Public dataSEC XBRL · 124 software companies

Benchmarking and planning

Software spending benchmark

How much US-listed software companies spend on sales and marketing, R&D and G&A, and how that relates to growth and margin: the latest annual figures of all 124 with revenue over $100M, from SEC's XBRL data, cleaned in SQL. The clearest pattern is size. G&A falls from 22% of revenue at $100M-$300M to 8% above $5B. The medians set the spending targets for a made-up 300-person company's annual plan.

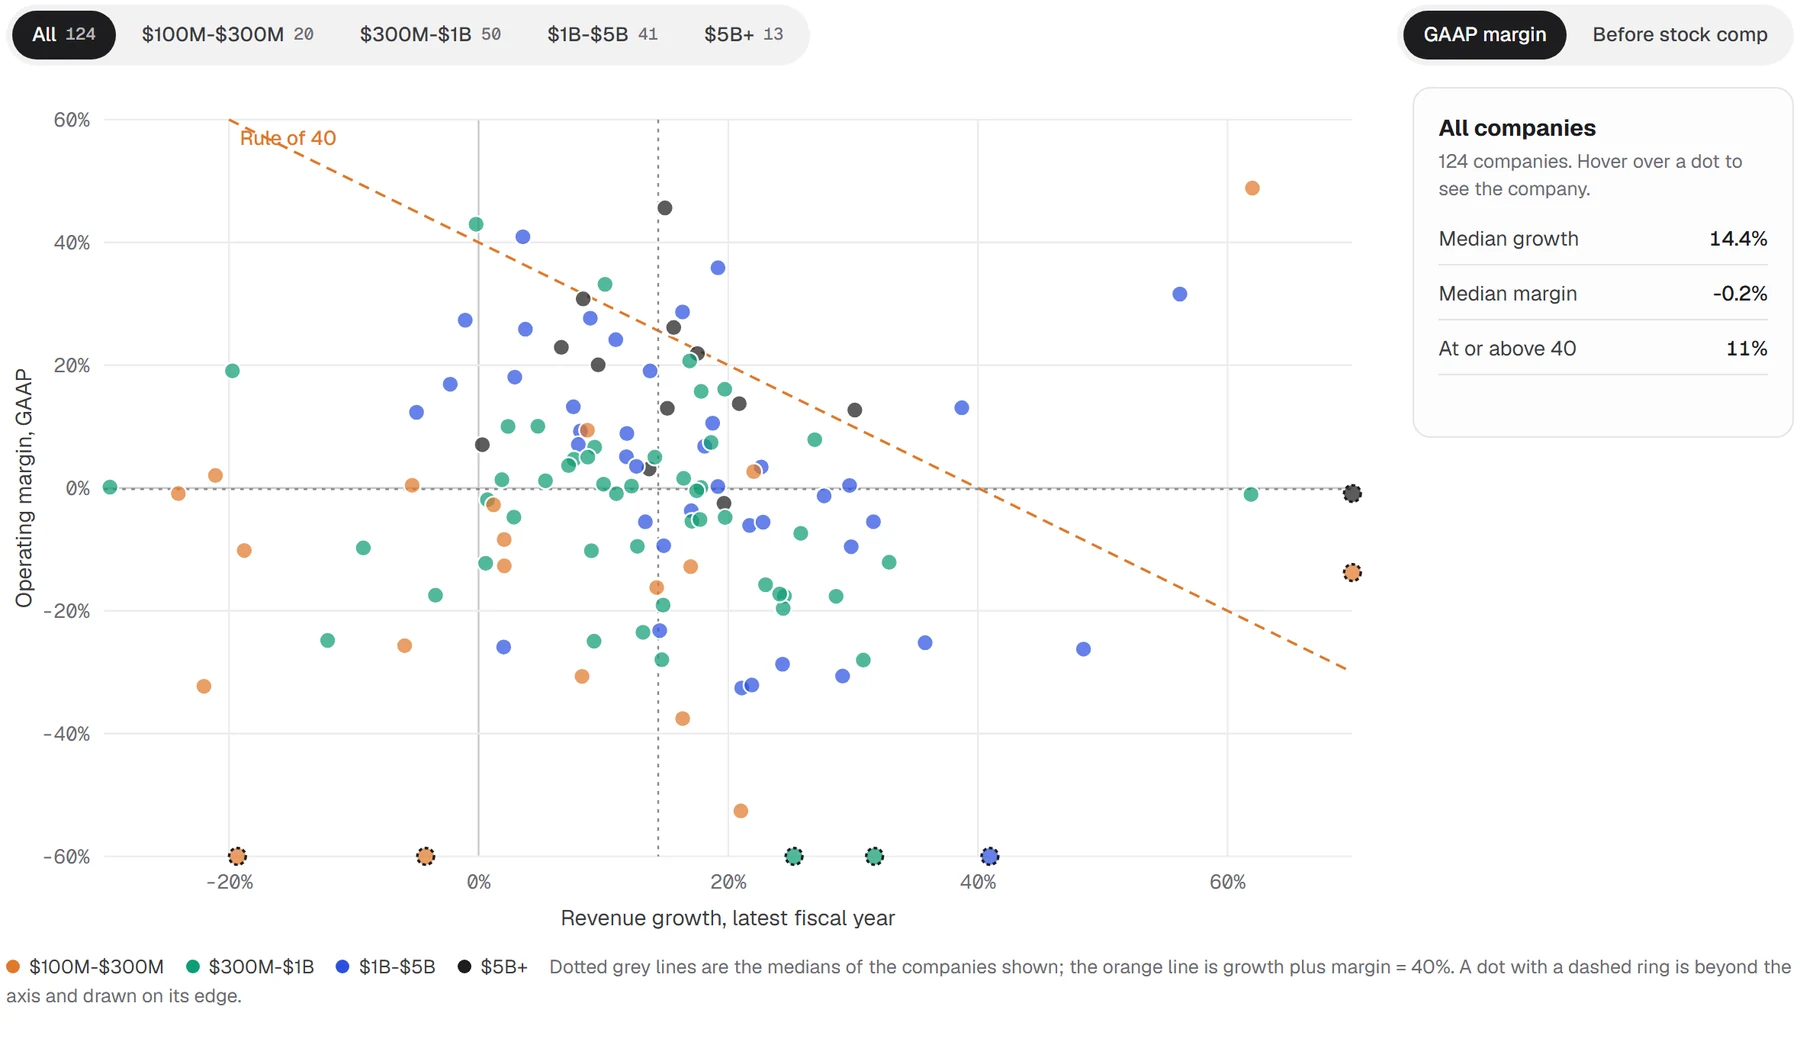
The benchmark's scatter: revenue growth against GAAP operating margin for 124 software companies, with the Rule of 40 line and the band filter.

Growth against operating margin, company by company

Pick a revenue band, or switch to margins before stock comp, and hover over a dot to see the company. The table gives the median of every ratio by band, with the middle half of companies under it.

Download the table · 5 KB
-20%0%20%40%60%-60%-40%-20%0%20%40%60%Revenue growth, latest fiscal yearOperating margin, GAAPRule of 40MICROSOFT CORP: growth 15%, margin 46%ORACLE CORP: growth 8%, margin 31%Salesforce, Inc.: growth 10%, margin 20%Block, Inc.: growth 0%, margin 7%INTUIT INC.: growth 16%, margin 26%ServiceNow, Inc.: growth 21%, margin 14%SHOPIFY INC.: growth 30%, margin 13%Autodesk, Inc.: growth 18%, margin 22%SYNOPSYS INC: growth 15%, margin 13%SS&C Technologies Holdings Inc: growth 7%, margin 23%Atlassian Corp: growth 20%, margin -3%CoreWeave, Inc.: growth 168%, margin -1%TWILIO INC: growth 14%, margin 3%Roblox Corp: growth 36%, margin -25%CrowdStrike Holdings, Inc.: growth 22%, margin -6%Snowflake Inc.: growth 29%, margin -31%Palantir Technologies Inc.: growth 56%, margin 32%Gen Digital Inc.: growth 4%, margin 41%Datadog, Inc.: growth 28%, margin -1%DOCUSIGN, INC.: growth 8%, margin 9%VEEVA SYSTEMS INC: growth 16%, margin 29%HUBSPOT INC: growth 19%, margin 0%Okta, Inc.: growth 12%, margin 5%PTC INC.: growth 19%, margin 36%Nutanix, Inc.: growth 18%, margin 7%DROPBOX, INC.: growth -1%, margin 27%MongoDB, Inc.: growth 23%, margin -6%Cloudflare, Inc.: growth 30%, margin -10%Paycom Software, Inc.: growth 9%, margin 28%Mobileye Global Inc.: growth 15%, margin -23%Unity Software Inc.: growth 2%, margin -26%Dynatrace, Inc.: growth 19%, margin 11%TERADATA CORP /DE/: growth -5%, margin 12%UiPath, Inc.: growth 13%, margin 4%Paylocity Holding Corp: growth 14%, margin 19%BENTLEY SYSTEMS INC: growth 11%, margin 24%Elastic N.V.: growth 17%, margin -4%BILL Holdings, Inc.: growth 13%, margin -6%PROCORE TECHNOLOGIES, INC.: growth 15%, margin -9%Rubrik, Inc.: growth 48%, margin -26%Zeta Global Holdings Corp.: growth 30%, margin 0%ZoomInfo Technologies Inc.: growth 3%, margin 18%Klaviyo, Inc.: growth 32%, margin -5%Guidewire Software, Inc.: growth 23%, margin 3%BOX INC: growth 8%, margin 7%Confluent, Inc.: growth 21%, margin -33%BLACKBAUD INC: growth -2%, margin 17%MANHATTAN ASSOCIATES INC: growth 4%, margin 26%SailPoint, Inc.: growth 24%, margin -29%CCC Intelligent Solutions Holdings Inc.: growth 12%, margin 9%Figma, Inc.: growth 41%, margin -122%Duolingo, Inc.: growth 39%, margin 13%Alarm.com Holdings, Inc.: growth 8%, margin 13%SentinelOne, Inc.: growth 22%, margin -32%Tenable Holdings, Inc.: growth 11%, margin -1%COMMVAULT SYSTEMS INC: growth 19%, margin 7%ServiceTitan, Inc.: growth 25%, margin -18%Gitlab Inc.: growth 26%, margin -7%APPFOLIO INC: growth 20%, margin 16%Clear Secure, Inc.: growth 17%, margin 21%WORKIVA INC: growth 20%, margin -5%Rapid7, Inc.: growth 2%, margin 1%Sprinklr, Inc.: growth 8%, margin 5%Freshworks Inc.: growth 16%, margin 2%Q2 Holdings, Inc.: growth 14%, margin 5%Asana, Inc.: growth 9%, margin -25%Coursera, Inc.: growth 9%, margin -10%Bandwidth Inc.: growth 1%, margin -2%SPS COMMERCE INC: growth 18%, margin 16%Vertex, Inc.: growth 12%, margin 0%Braze, Inc.: growth 24%, margin -20%Clearwater Analytics Holdings, Inc.: growth 62%, margin -1%APPIAN CORP: growth 18%, margin 0%Netskope Inc: growth 32%, margin -92%Navan, Inc.: growth 31%, margin -28%BLACKLINE, INC.: growth 7%, margin 4%QUALYS, INC.: growth 10%, margin 33%Fastly, Inc.: growth 15%, margin -19%VARONIS SYSTEMS INC: growth 13%, margin -24%OneStream, Inc.: growth 23%, margin -16%nCino, Inc.: growth 10%, margin 1%EverCommerce Inc.: growth 5%, margin 10%BLACKBERRY Ltd: growth -30%, margin 0%JFrog Ltd: growth 24%, margin -17%Skillsoft Corp.: growth -3%, margin -17%N-able, Inc.: growth 9%, margin 7%Intapp, Inc.: growth 17%, margin -5%PagerDuty, Inc.: growth 5%, margin 1%Sprout Social, Inc.: growth 13%, margin -10%Xperi Inc.: growth -9%, margin -10%SEMrush Holdings, Inc.: growth 18%, margin -5%ALKAMI TECHNOLOGY, INC.: growth 33%, margin -12%Via Transportation, Inc.: growth 29%, margin -18%AvePoint, Inc.: growth 27%, margin 8%Certara, Inc.: growth 9%, margin 5%GRID DYNAMICS HOLDINGS, INC.: growth 17%, margin -0%C3.ai, Inc.: growth 25%, margin -83%3D SYSTEMS CORP: growth -12%, margin -25%Consensus Cloud Solutions, Inc.: growth -0%, margin 43%Amplitude, Inc.: growth 15%, margin -28%Commerce.com, Inc.: growth 3%, margin -5%MARKETWISE, INC.: growth -20%, margin 19%Huckleberry.ai, Inc.: growth 1%, margin -12%Inspired Entertainment, Inc.: growth 2%, margin 10%Cerence Inc.: growth -24%, margin -1%LIVEPERSON INC: growth -22%, margin -32%Definitive Healthcare Corp.: growth -4%, margin -93%Weave Communications, Inc.: growth 17%, margin -13%PLAYSTUDIOS, Inc.: growth -19%, margin -10%PDF SOLUTIONS INC: growth 22%, margin 3%Exzeo Group, Inc.: growth 62%, margin 49%Upland Software, Inc.: growth -21%, margin 2%Couchbase, Inc.: growth 16%, margin -38%Meridian Holdings Inc./NV: growth 21%, margin -53%KALTURA INC: growth 1%, margin -3%WM TECHNOLOGY, INC.: growth -5%, margin 0%SOUNDHOUND AI, INC.: growth 99%, margin -14%CS Disco, Inc.: growth 8%, margin -31%Backblaze, Inc.: growth 14%, margin -16%Expensify, Inc.: growth 2%, margin -13%ON24 INC.: growth -6%, margin -26%BigBear.ai Holdings, Inc.: growth -19%, margin -168%CareCloud, Inc.: growth 9%, margin 9%SOUNDTHINKING, INC.: growth 2%, margin -8%
All companies124 companies. Hover over a dot to see the company.
Median growth
14.4%
Median margin
-0.2%
At or above 40
11%

$100M-$300M$300M-$1B$1B-$5B$5B+Dotted grey lines are the medians of the companies shown; the orange line is growth plus margin = 40%. A dot with a dashed ring is beyond the axis and drawn on its edge.

Median (middle half)$100M-$300M$300M-$1B$1B-$5B$5B+All
Sales & marketing25.4%22% to 37%33.8%21% to 44%34.9%19% to 42%15.2%10% to 27%32.5%18% to 42%
R&D20.5%15% to 30%21.4%15% to 26%24.0%20% to 29%15.6%12% to 22%21.9%15% to 28%
G&A22.4%19% to 28%18.8%16% to 23%13.7%11% to 17%8.3%7% to 10%16.3%12% to 20%
Gross margin71.8%58% to 75%73.8%66% to 79%75.5%72% to 81%71.7%49% to 78%74.1%65% to 79%
Operating margin, GAAP-12.7%-31% to -1%-1.5%-17% to 5%3.5%-9% to 17%13.7%7% to 23%-0.2%-14% to 10%
Operating margin before stock comp2.3%-10% to 7%8.6%2% to 16%19.1%9% to 27%27.0%17% to 33%13.0%3% to 24%
Revenue growth2.1%-9% to 17%13.7%6% to 20%17.0%9% to 24%15.1%10% to 20%14.4%5% to 22%
CompaniesS&M and G&A reported separately2016504741391313124115

How it was built. I built it with an AI agent system I run. It wrote the pipeline and the SQL to my brief, I went through it myself, and a separate check re-derives its figures from the source data.

0%10%20%30%$100M-$300M22.4%$300M-$1B18.8%$1B-$5B13.7%$5B+8.3%
G&A is the line that clearly falls with size: the median goes from 22.4% of revenue at $100M-$300M to 8.3% above $5B. The bars are the middle half of companies in each band.
Share of revenueTargetRangeFrom
Sales and marketing33.2%21% to 43%companies under $1B63 companies
Research and development21.4%15% to 27%companies under $1B70 companies
General and administrative22.4%19% to 28%companies at $100M-$300M16 companies
The targets for the plan. Below $5B, S&M and R&D shares do not move with size, so they use all companies under $1B; G&A does, so it uses the smallest band.
CREATE TABLE item_map (item TEXT, concept TEXT, priority INTEGER, why TEXT);
INSERT INTO item_map VALUES
 ('cost_of_revenue', 'CostOfRevenue', 1, 'the usual tag for total cost of revenue'),
 ('cost_of_revenue', 'CostOfGoodsAndServicesSold', 2, 'used instead by filers such as Salesforce; same line'),
 ('gross_profit', 'GrossProfit', 1, 'reported gross profit; if absent it is computed as revenue less cost of revenue'),
 ('sm', 'SellingAndMarketingExpense', 1, 'sales and marketing as its own line'),
 ('ga', 'GeneralAndAdministrativeExpense', 1, 'general and administrative as its own line'),
 ('sga', 'SellingGeneralAndAdministrativeExpense', 1, 'combined SG&A; used for S&M + G&A only when the two are not split'),
 ('rd', 'ResearchAndDevelopmentExpense', 1, 'research and development'),
 ('rd', 'ResearchAndDevelopmentExpenseExcludingAcquiredInProcessCost', 2, 'same line, tagged without acquired in-process R&D'),
 ('opex', 'OperatingExpenses', 1, 'total operating expenses, used only as a cross-check'),
 ('operating_income', 'OperatingIncomeLoss', 1, 'GAAP operating income (loss)'),
 ('sbc', 'ShareBasedCompensation', 1, 'stock comp added back in the cash flow statement: the full-year total'),
 ('sbc', 'AllocatedShareBasedCompensationExpense', 2, 'stock comp expense from the notes, when the cash flow line is not tagged');
Every cleaning rule is a SQL view or rules table with a one-line reason next to it. This one says which XBRL tag counts for which line.

The full analysis

Each part opens on click.

The memo: targets for the planS&M 33.2%, R&D 21.4%, G&A 22.4% of revenue

Recommendation. Plan sales and marketing at 33.2% of revenue (range 21% to 43%), R&D at 21.4% (15% to 27%) and G&A at 22.4% (19% to 28%). Each point is the median of the comparable public companies and each range is the middle half of them.

Share of revenueTargetRangeFrom
Sales and marketing33.2%21% to 43%companies under $1B63 companies
Research and development21.4%15% to 27%companies under $1B70 companies
General and administrative22.4%19% to 28%companies at $100M-$300M16 companies

What the benchmark shows. Size decides G&A: the bigger the company, the smaller its G&A share (rank correlation −0.76). Below $5B, size does not decide S&M or R&D (rank correlations 0.01 and 0.18). What goes with S&M and R&D is growth (rank correlations 0.24 and 0.30). By thirds of companies by growth (median growth 1.5%, 14.5% and 25.8%), S&M runs 23.6%, 32.7% and 37.3% of revenue, and R&D 16.8%, 21.9% and 26.7%; G&A does not move with growth (17.0%, 15.7%, 16.5%). So the S&M and R&D lines should both follow the plan's growth target, and both points above assume growth in the low to mid teens.

Not used: the all-company medians. They are simpler, but they mix in the largest software companies, whose G&A share is about a third of a small company's: the all-company G&A median is 16.3%, against 22.4% for the smallest band, which would understate the plan's overhead by about 6 points of revenue. Nor only the most efficient companies (growth plus margin of at least 40%): under $1B there are 5 of them on GAAP figures and 10 before stock comp, too few to set a target.

Caveats. Public companies are bigger than a 300-person company: the smallest here, SOUNDTHINKING, INC., had $104M of revenue, so the plan's G&A is more likely to sit at the top of its range than the bottom. The figures are GAAP, so every line includes stock-based compensation, a median 11.8% of revenue under $1B; a private company that pays less in stock will show lower expense for the same people. The three medians come from different companies and do not add up to one real company: under $1B the median gross margin is 72.4% and the median GAAP operating margin -5.0%.

What the benchmark showsSize decides G&A; growth does not cost margin once stock comp is added back
01
−0.76

G&A shrinks as a share of revenue as companies grow

The rank correlation between revenue and G&A share is −0.76 across 115 companies, the strongest relationship in the data. The median falls band by band: 22% at $100M-$300M, 19% at $300M-$1B, 14% at $1B-$5B, 8% at $5B+.

Overhead is the line where scale shows. A small company should plan G&A from its own size band, not the market median.

02
0.06

Faster growers are not less profitable before stock comp

Growth and GAAP operating margin are only weakly related (−0.16), and with stock comp added back the relationship is gone (0.06). Before stock comp, the slowest third's median margin is 11.0% and the fastest third's 12.2%.

In this year's data, growth was not bought with lower margins before stock comp.

03
19%

Spending rises with growth: S&M, R&D and stock comp

S&M and R&D shares rise with growth (rank correlations 0.24 and 0.30); G&A does not. So does stock comp: the fastest-growing third pays a median 19.2% of revenue in stock comp, against 8.2% for the slowest third. Stock comp share and GAAP margin move against each other (−0.58), which is why the fast third's GAAP margin (-6.1%) is below the slow third's (1.7%).

Compare growth companies before stock comp, and plan stock comp as its own line.

04
26%

Few clear the Rule of 40 on GAAP figures

Growth plus GAAP operating margin is at least 40 for 11% of the companies and 26% before stock comp. It rises with size: before stock comp, 10% at $100M-$300M, 16% at $300M-$1B, 32% at $1B-$5B, 69% at $5B+.

Below $1B the median company is far from 40; a plan that promises it should say which line pays for it.

How the data was cleaned, in SQLEach rule is a view in sql/, with its reason on the line next to it

SEC's XBRL data is large and inconsistent: 3 different tags carry the top line, some filers split S&M from G&A and some do not, fiscal years end in every month, and each year is reported again, sometimes restated, in later 10-Ks. The raw values go into SQLite unchanged, and every rule below is a view on top of them.

Full years only, latest filing wins

Only 10-K values covering 350 to 380 days count. The same year appears again as a comparative in later filings, so the most recently filed value is kept, with its accession number, form and filing date. Across every year in these companies' filings, 775 values in 61 companies changed between filings; 3 of the values the benchmark uses are among them.

One fiscal year per company

Each company is measured on its latest full fiscal year ending between January 2025 and January 2026. SEC's CY2025 frame would have put 7 of the 124 companies on a different year (February to May year-ends, which it assigns to the year ending in 2026) and has no CY2025 value for 1. Measuring all companies on the year with the most days in 2025 instead changes 12 companies' year and moves the S&M target to 33.6%, R&D to 21.4% and G&A to 22.4%.

Revenue: three tags in use

RevenueFromContractWithCustomerExcludingAssessedTax (111), Revenues (7), RevenueFromContractWithCustomerIncludingAssessedTax (6). When a filer uses two, the larger is the total; the smaller leaves out items such as interest on client funds.

S&M, G&A and combined SG&A

115 report S&M and G&A separately, 8 report only combined SG&A, 1 reports G&A but no S&M line (left out of both medians). Combined-only filers stay in their own bucket and are not in the S&M or G&A medians.

Gross profit and operating income

Gross profit is reported by 104 companies and computed as revenue less cost of revenue for 10; 10 show neither, so they have no gross margin. Operating income is computed from gross profit and total operating expenses where a filer tags no subtotal (1 here).

CREATE VIEW v_fy AS
SELECT cik, MAX("end") AS fy_end
FROM v_revenue_annual
WHERE "end" BETWEEN '2025-01-01' AND '2026-01-31'
GROUP BY cik;
CREATE VIEW v_annual_all AS
SELECT f.*,
       CAST(julianday(f."end") - julianday(f.start) + 1 AS INTEGER) AS days
FROM fact f
WHERE f.unit = 'USD'                       -- why: ratios need dollar values; share counts and per-share values are other units
  AND f.form IN ('10-K', '10-K/A')         -- why: a full year is reported in the 10-K; 10-Q values are quarters or year-to-date
  AND f.start IS NOT NULL                  -- why: income-statement lines are durations; a value with no start is a balance
  AND julianday(f."end") - julianday(f.start) + 1 BETWEEN 350 AND 380;
                                           -- why: a 12-month period, allowing 52/53-week years; drops quarters a 10-K also tags
Who is in it, and who dropped out1,298 filers in SEC's frames, 151 in SIC 7372, 124 in the benchmark
StepFilers
Filers in the CY2024/CY2025 frames with a revenue tag >= $100M and an R&D tag1,298
of which SIC 7372 (prepackaged software)151
of which SIC 7371 or 7374, counted but not added42
SIC 7372 with a 10-K fiscal year ending Jan 2025 to Jan 2026124
and revenue >= $100M in that year: the benchmark124

Of the 151 software filers, 27 are not in the benchmark: 17 because they file a 20-F or 40-F as foreign private issuers, not a 10-K, and 10 because they stopped reporting before filing a 10-K for a year ending January 2025 to January 2026 (each has a Form 15 deregistration on file). Every name and reason is in dropouts.csv. The 42 filers in SIC 7371 and 7374 are listed but not added: those codes mix software with IT services and payment processing, and picking the software ones by hand would put a judgment call into the sample.

What the checks caughtSeven checks in SQL, and a second derivation in Python

A check found that two filers' SG&A tag already contains R&D, Paycom's and a smaller company's (both are in the check's output): gross profit less SG&A alone equals their operating income. Their combined SG&A share would have counted R&D twice, so a rule now leaves it out. The third company that check lists, SOUNDHOUND AI, INC., is real: a large gain on earn-out liabilities sits inside its operating expenses.

Amplitude tags no operating income at all, so it first fell out of every margin figure; the rule above now computes it from gross profit and total operating expenses. Paylocity's two revenue tags differ by 7.7%: the larger includes interest on client funds and is its reported total. A second derivation in Python, from the raw JSON and without SQL, reproduces every company's ratios and every quartile on this page exactly, and confirms revenue, S&M, G&A and R&D each sit in SEC's XBRL data under the accession number given.

Limits and next

Public companies are bigger than the company the targets are for. Only companies that filed a 10-K for a year ending January 2025 to January 2026 are in: the 10 that deregistered before filing one are not, while 7 that deregistered after their last 10-K are in, on that year (for example Couchbase, on its year to January 2025). One year is a snapshot; growth and margins in 2025 reflect that year's market. companyfacts carries no breakdown by function, so stock comp cannot be taken out of S&M, R&D and G&A one by one, only out of operating income as a whole. SIC codes are chosen by the filer and rarely updated, so the group includes a few companies, such as 3D Systems, whose main business is not software.

Next: run the same SQL on the prior two years to see whether the patterns hold, and add free cash flow margin, the more common partner to growth in the Rule of 40.

Files and source