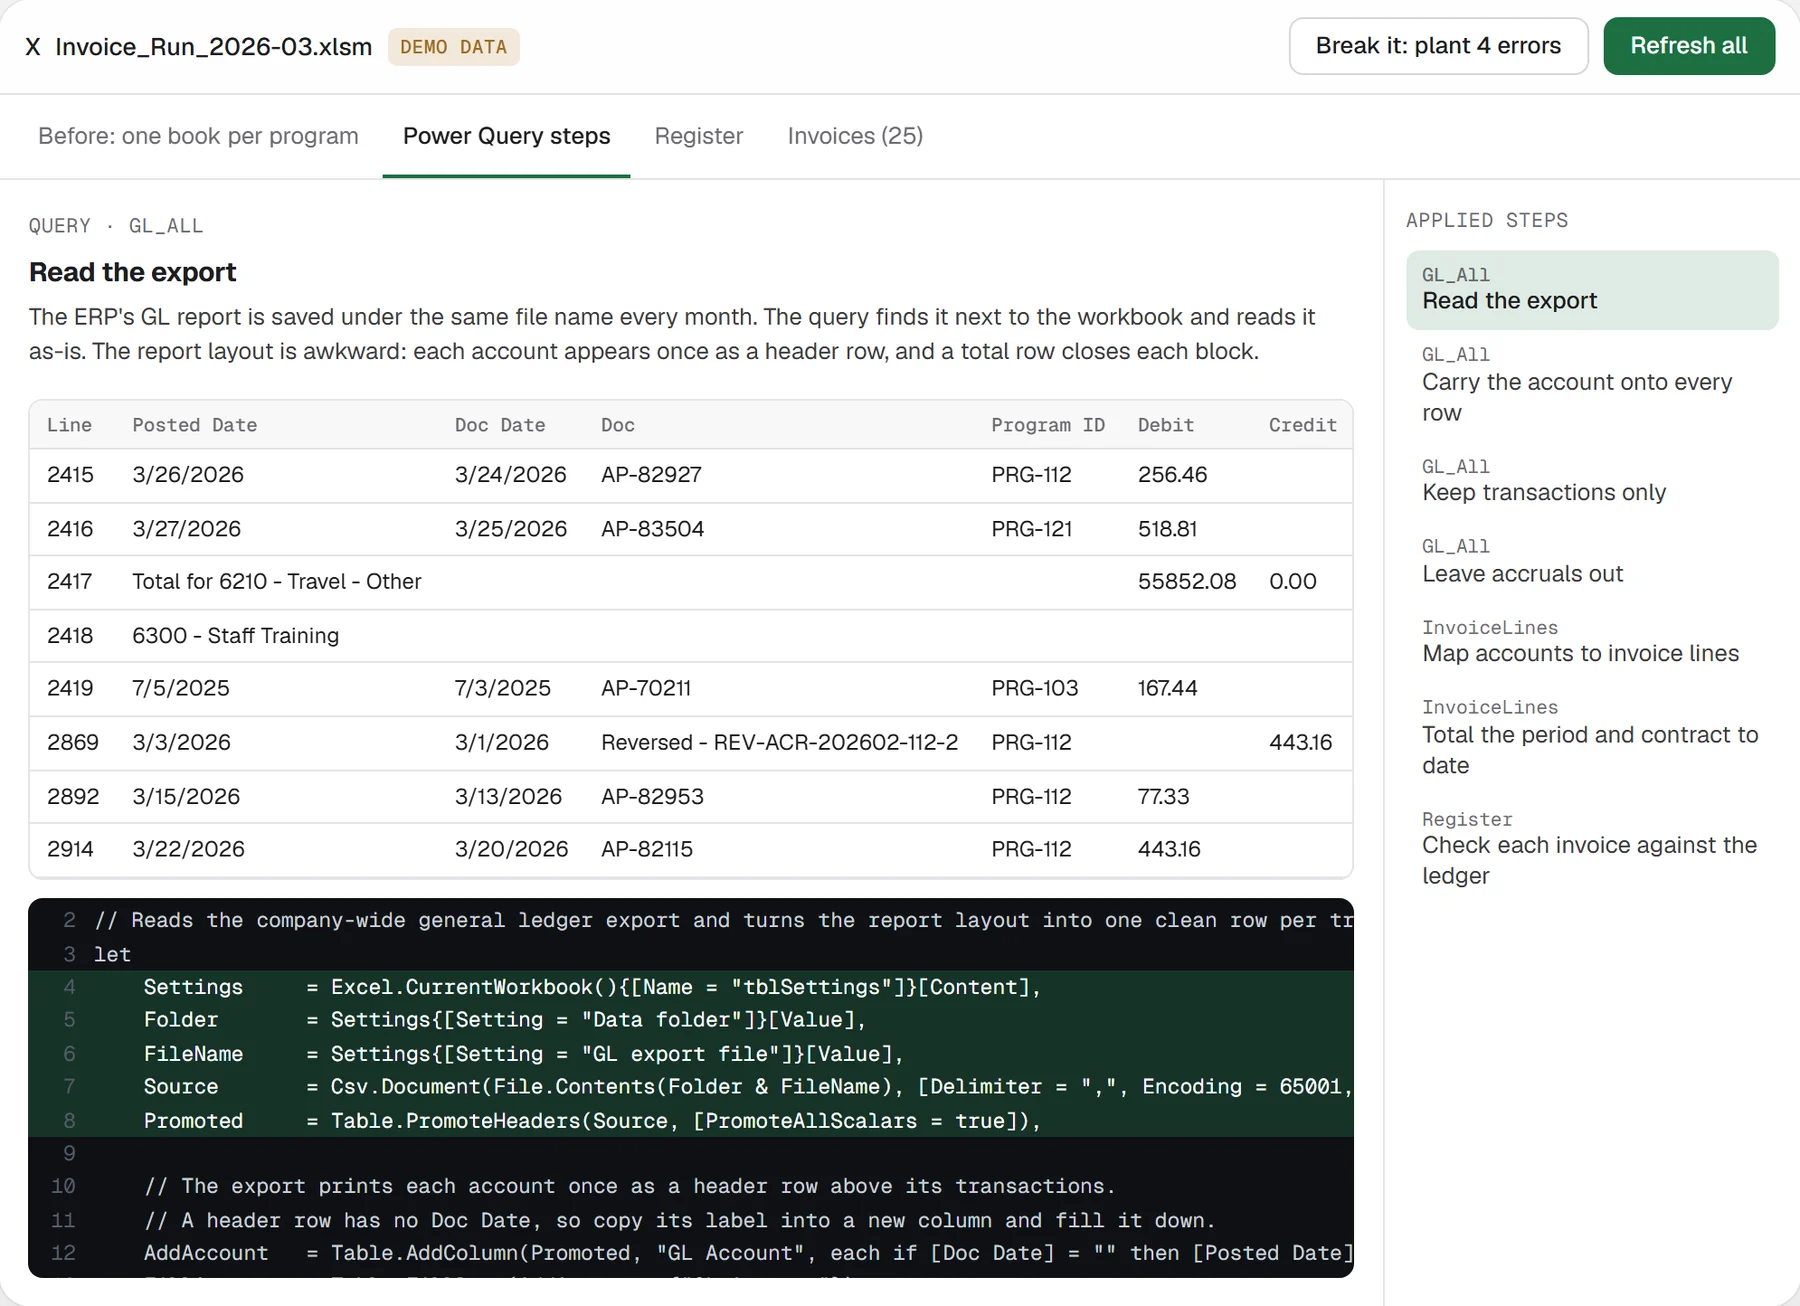
Loads. Each program's monthly workbook is loaded into one database and compared with the workbook's own total. A load that is off by any amount stays out of the review until it is fixed and loaded again.
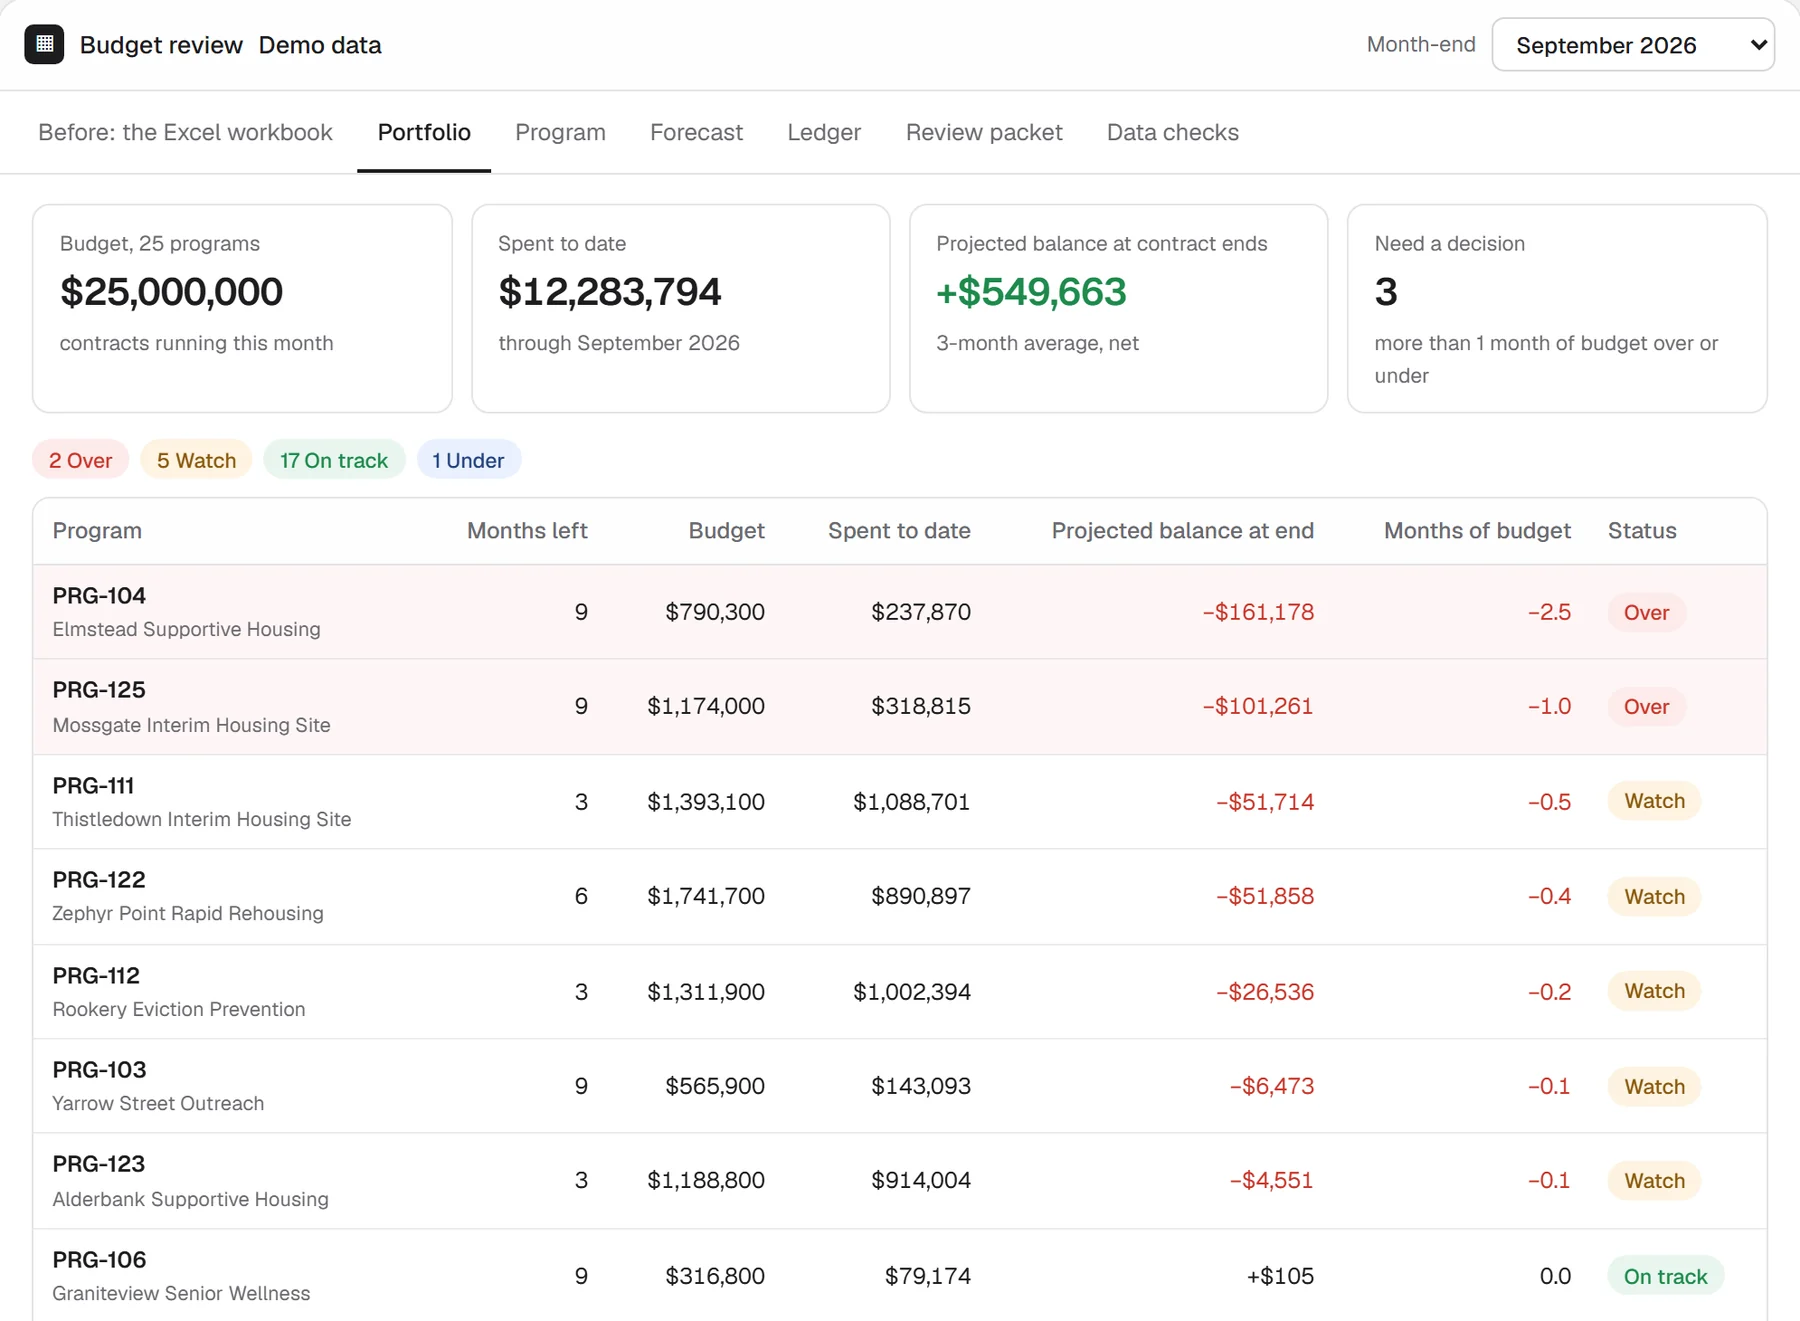
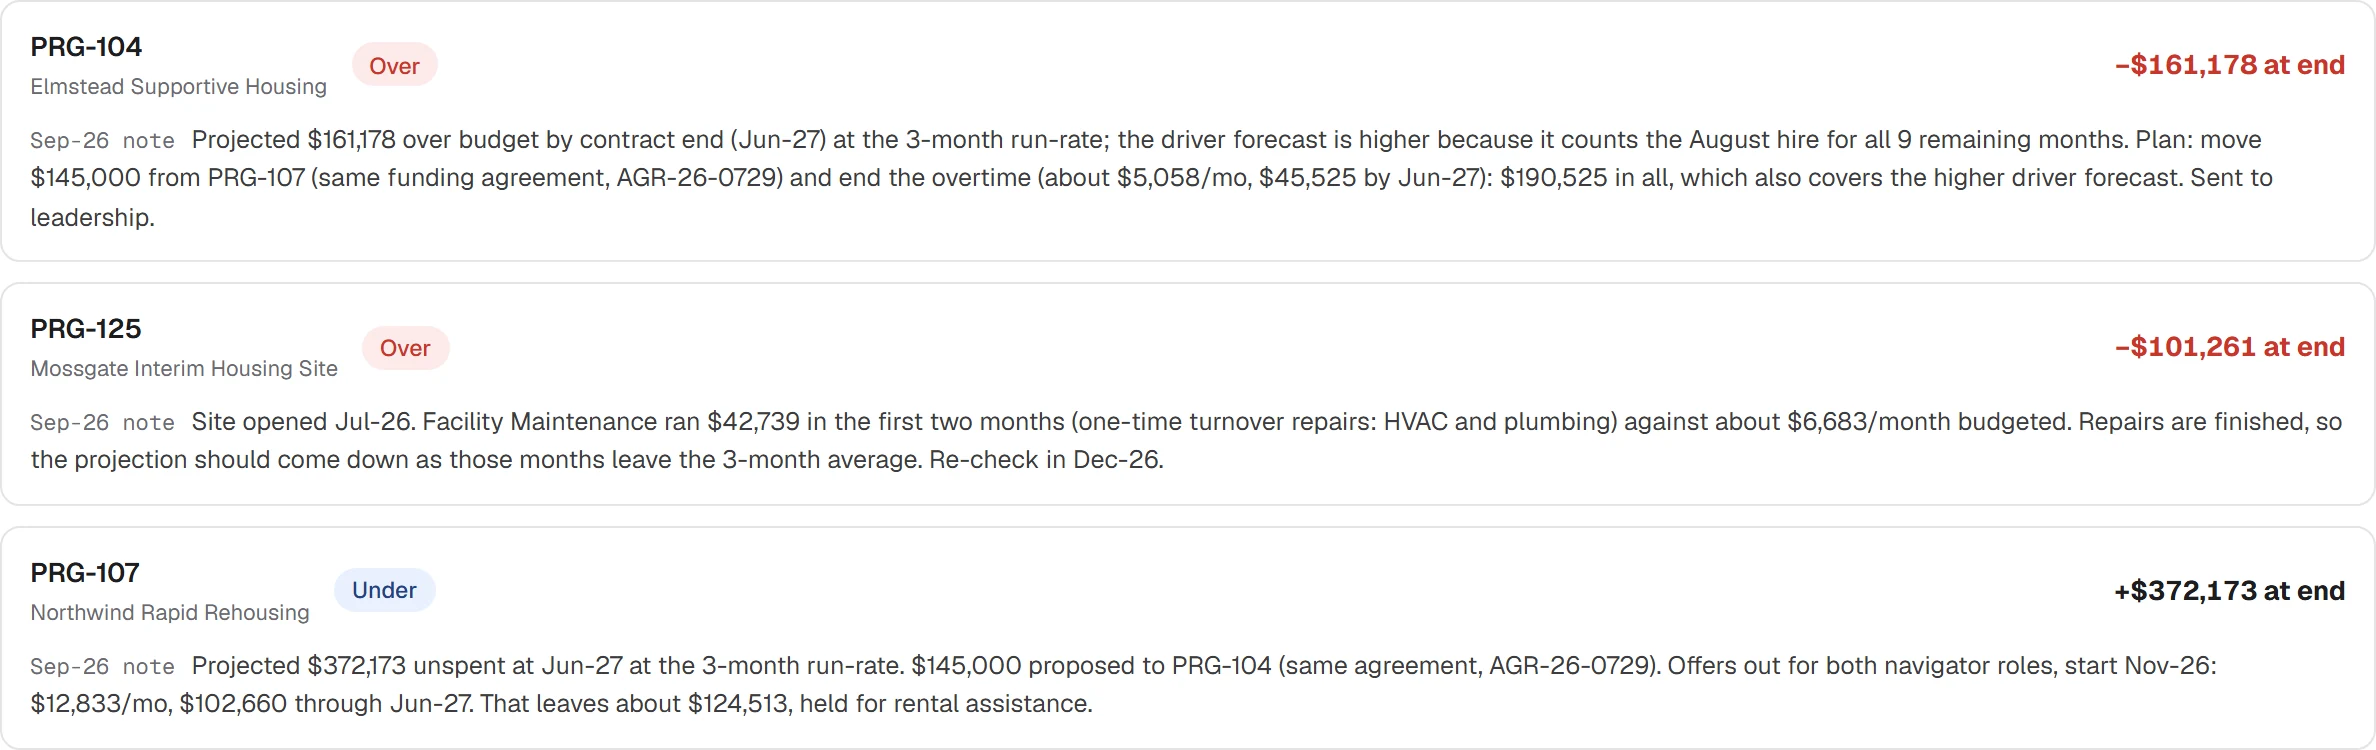
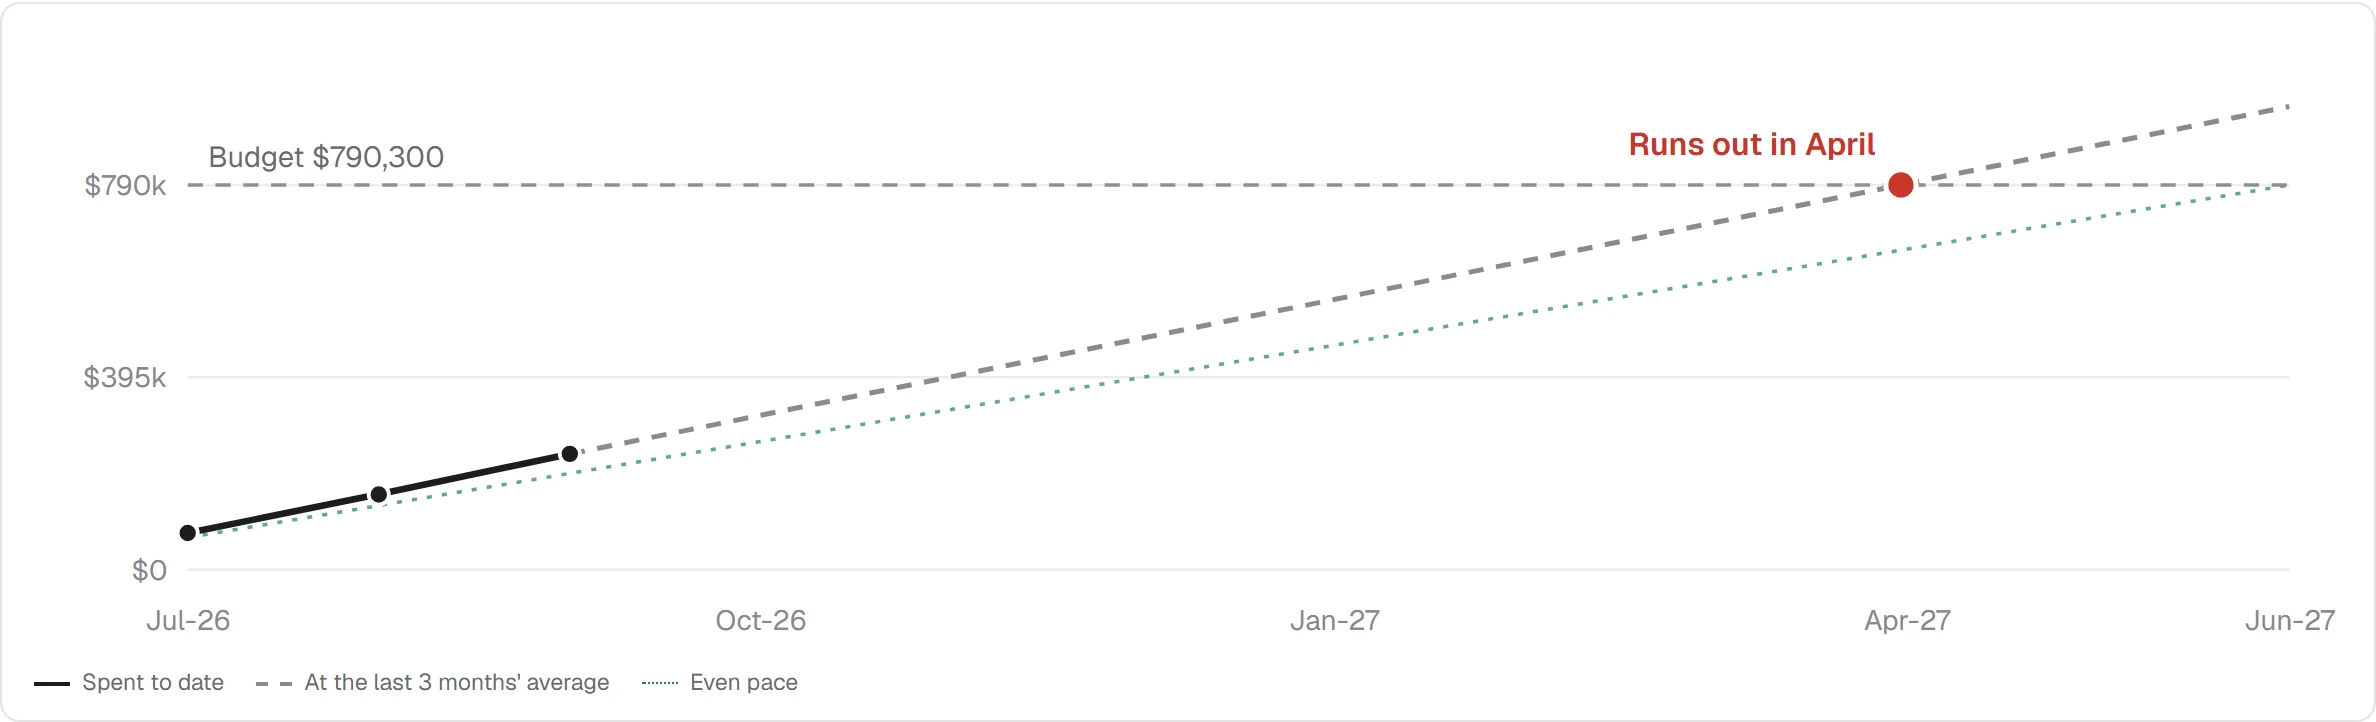
Projection. Spending to date plus the average of the last three months, times the months left. A month with no spend on a line counts as zero, so a one-off cost stays in the average for three months and then drops out; the note says when that is the reason a program is red.
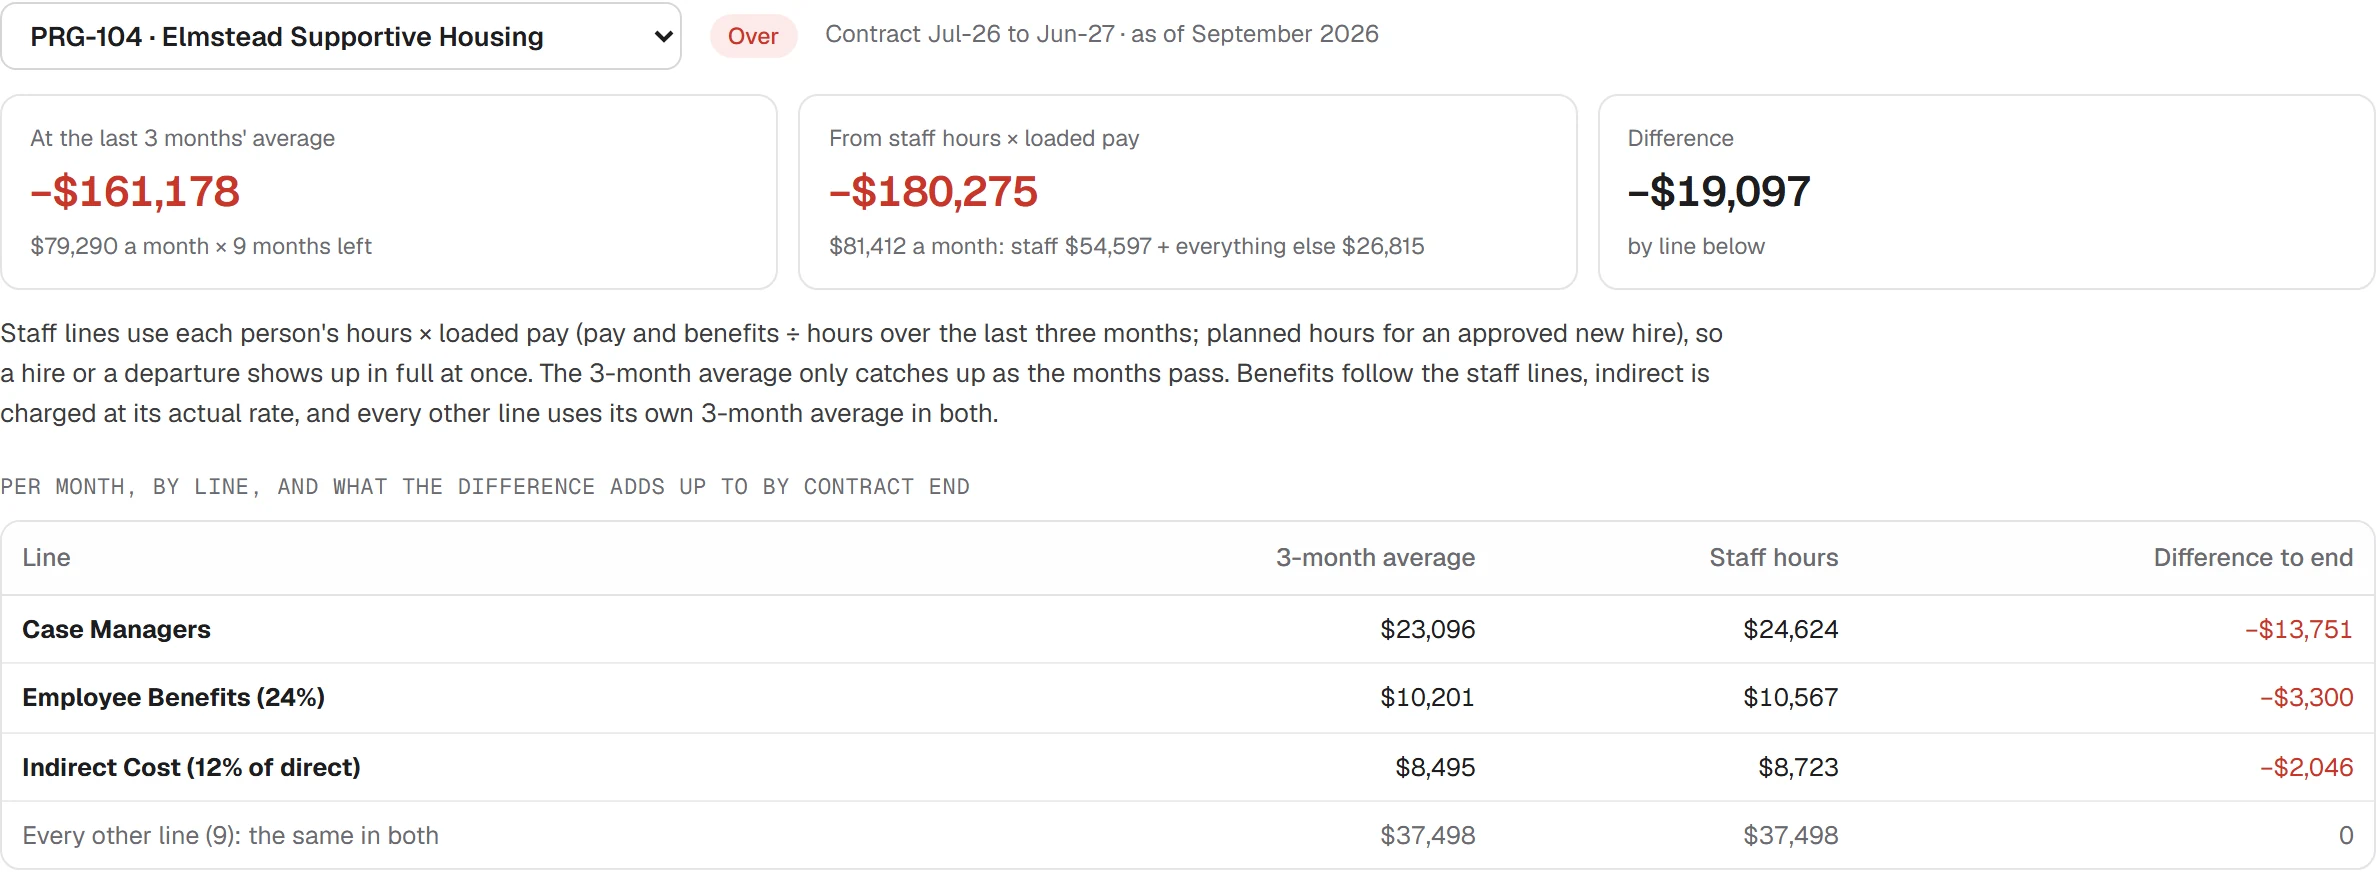
Staff hours. The second forecast rebuilds the staff lines from people: each person's hours × loaded pay (pay and benefits ÷ hours over the last three months, or planned hours for an approved new hire), benefits on the benefits line, indirect at its actual rate, every other line at its own 3-month average. When the same people worked all three months the two forecasts agree; when someone joins or leaves, they differ, and the Forecast view shows by how much on each line.
What needs a decision. The projected balance at contract end, measured in months of the program's own budget (the budget spread evenly over the contract): more than one month over or under needs a decision; a smaller overage is Watch.
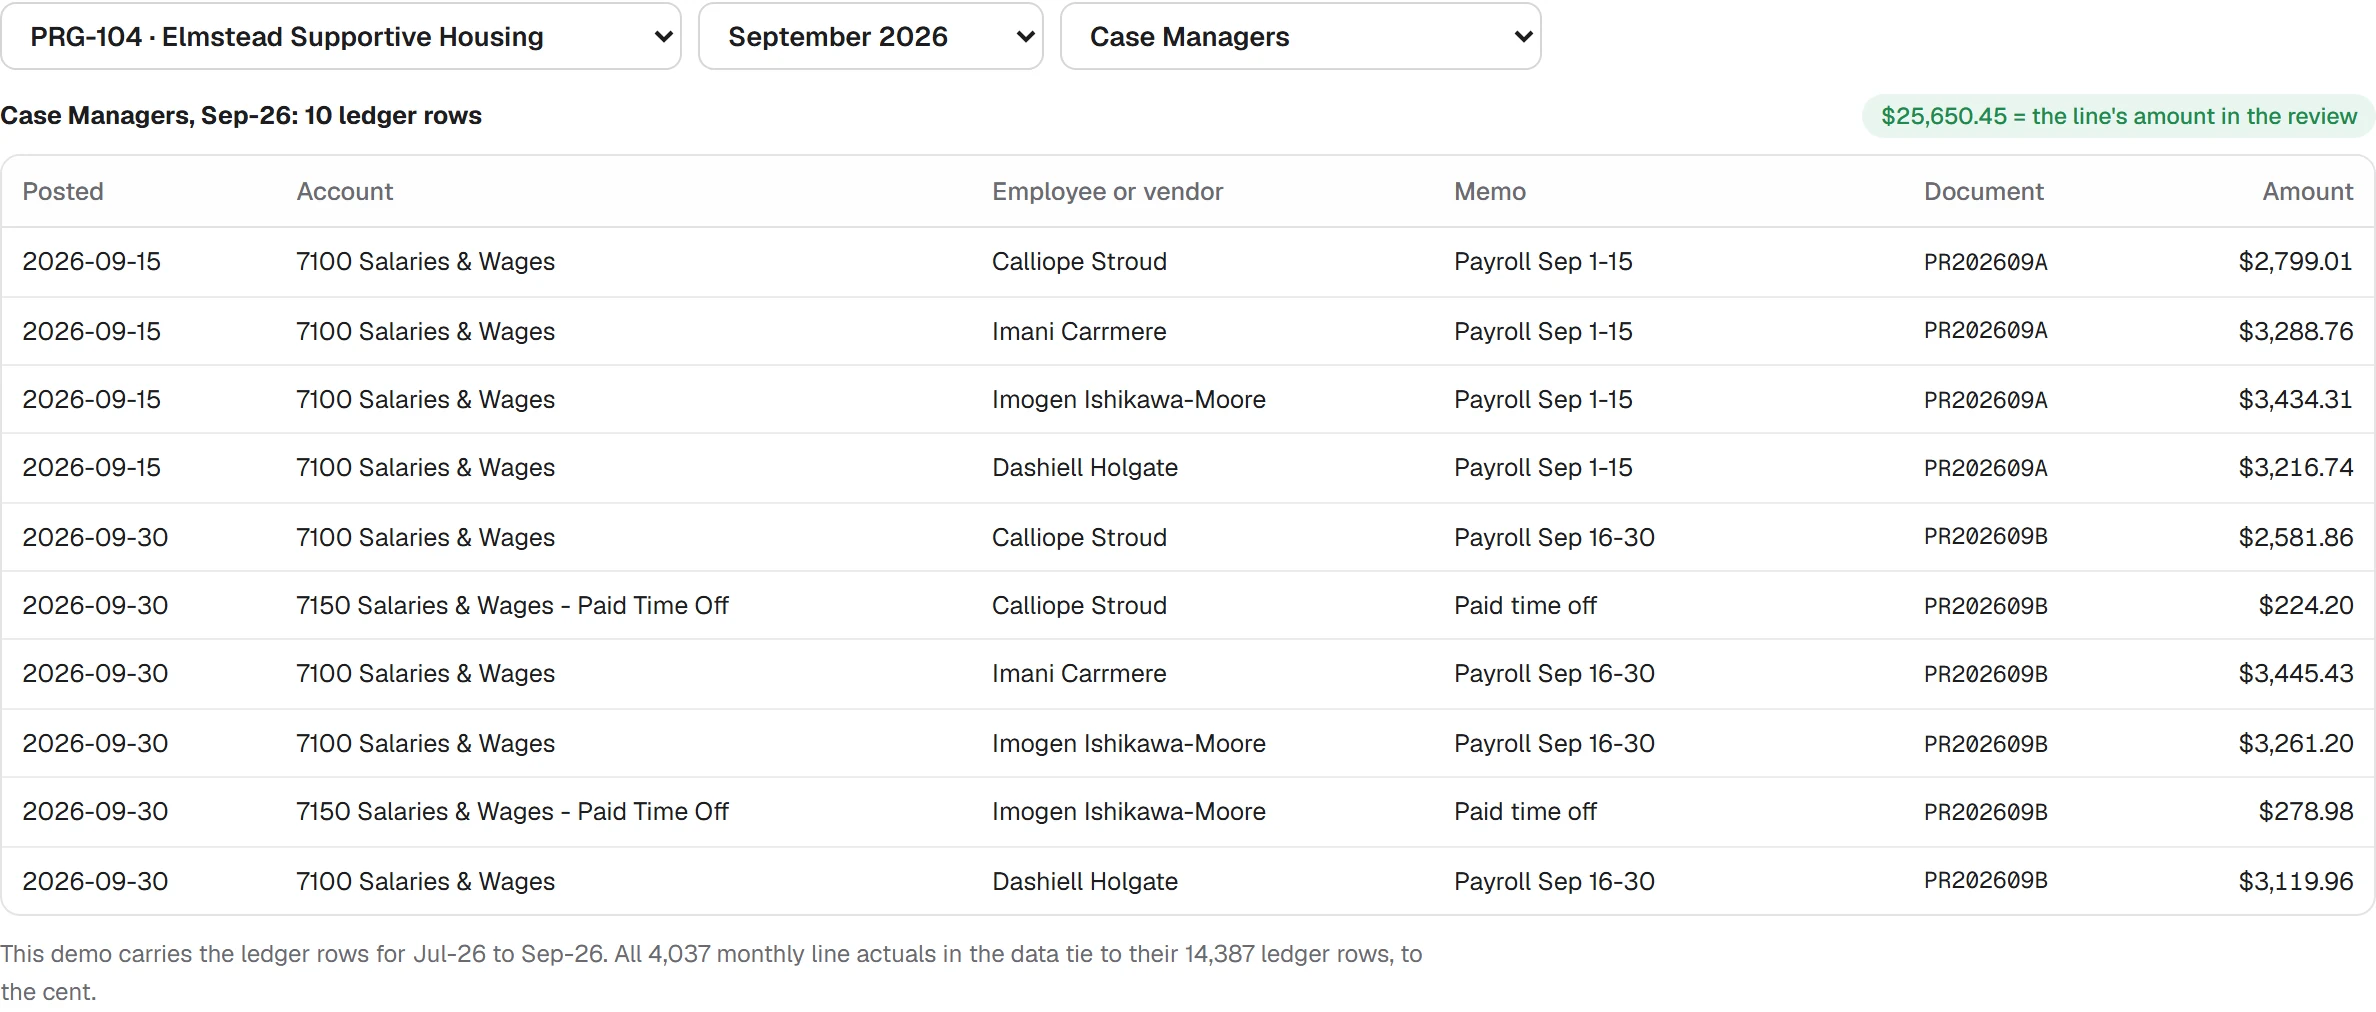
Down to the ledger. Every line in the last three months drills down to the ledger rows behind it (this demo carries three months of rows). The script that builds this page ties all 4,037 monthly line actuals to the 14,387 ledger rows behind them, to the cent, and checks every 3-month projection against the one stored with the data. The month picker shows the review as it stood at any of the last twelve month-ends.