Headcount and opex planning
FY2027 headcount and opex plan
The annual hiring and operating-expense plan for Tillbrook Software, a made-up B2B software company of about 300 people. It is built from drivers: hires by team, level and month, attrition and backfills, pay pegged to public San Francisco wage data, and sales capacity that turns into ARR. The memo recommends approving 52 of the 60 hires now, with the account executives a quarter earlier, and holding 8 R&D hires for a quarter.
The plan
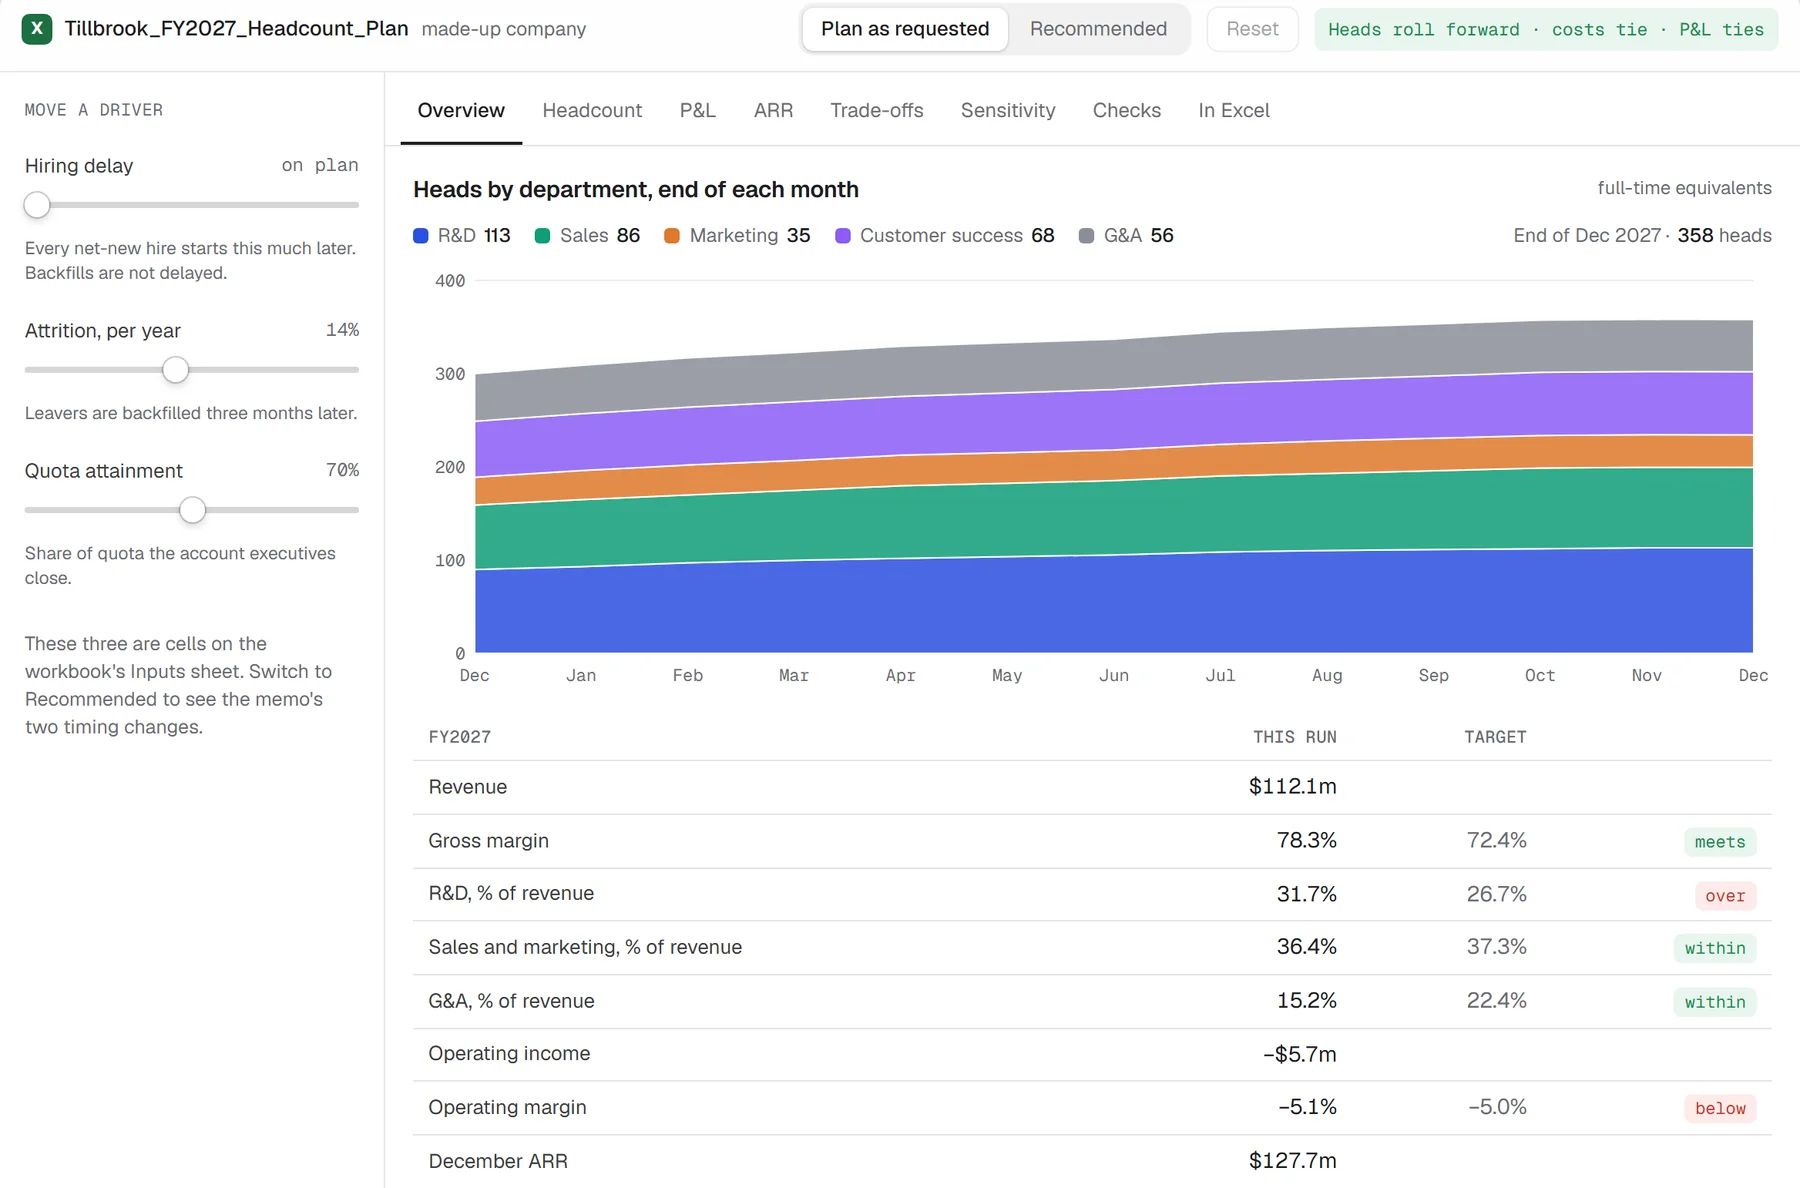
Move the hiring delay, attrition or quota attainment and the whole plan recalculates: heads by month, cost by department, ARR, the P&L and its checks. The logic is the workbook's, line for line.
Heads by department, end of each month
full-time equivalents| FY2027 | This run | Target | |
|---|---|---|---|
| Revenue | $112.1m | ||
| Gross margin | 78.3% | 72.4% | meets |
| R&D, % of revenue | 31.7% | 26.7% | over |
| Sales and marketing, % of revenue | 36.4% | 37.3% | within |
| G&A, % of revenue | 15.2% | 22.4% | within |
| Operating income | −$5.7m | ||
| Operating margin | −5.1% | −5.0% | below |
| December ARR | $127.7m | ||
| December heads | 358 | ||
| Roadmap module ships | July |
Targets are medians from a benchmark of 124 public software companies' 10-K filings; sales and marketing and R&D use the fast-growth third, as the plan grows ARR 30%. Revenue per average head: $327k against a peer median of $336k.
How it was built. I built it with an AI agent system I run. It wrote the pipeline and the workbook to my brief, I went through it myself, and a separate check re-derives its figures from the source data. Tillbrook Software is made up because no company publishes its hiring plan by team; the pay, benefit and benchmark anchors are public.
The full analysis
Each part opens on click.
The memoOne page to the CEO and CFO; the first sentence is the recommendation
Recommendation. Approve 52 of the 60 net-new hires requested for FY2027 now, including the 12 account executives a quarter earlier than requested, and hold the other 8, one in three of the R&D hires, until a quarter after their requested month. Against the plan as requested, this adds $0.15m of cost in FY2027 and $0.98m of December ARR, improves operating income by $0.26m to −$5.4m (−4.8% of revenue), and ships the roadmap module in August instead of July.
The plan as requested. Headcount goes from 300 to 358 by December. Revenue is $112.1m and operating income −$5.7m (−5.1% of revenue, against a −5.0% median for public software companies under $1B). R&D is the one line over its target: 31.7% of revenue against 26.7% for fast-growing software companies, mostly because the plan pays every engineer at San Francisco rates. Sales and marketing is 36.4% against 37.3%. G&A is 15.2% against 22.4%; that is below the benchmark's 25th percentile (19.5%), and smaller companies usually run higher G&A, so this line is more likely under-budgeted than over.
The option I rejected. Delaying every net-new hire by a quarter saves $4.15m and lifts operating income by $3.52m, but the saving happens once, while the $1.72m of December ARR it gives up is lost every year after, and the module slips to October. The recommended plan already reaches the benchmark median operating margin without giving up ARR, so there is no reason to buy margin with it.
Trade-off 1: hold a third of R&D hires for a quarter. It saves $0.64m in FY2027 and costs $0.15m of December ARR, because the module ships a month later. The model does not count the later roadmap items that slip with it; that is the real cost, and the reason to hold only a third.
Trade-off 2: hire account executives a quarter earlier. It costs $0.79m more in FY2027 and adds $1.13m of December ARR. At the plan's 78% gross margin that ARR earns back its extra cost in about 11 months. Together the two changes pay for each other.
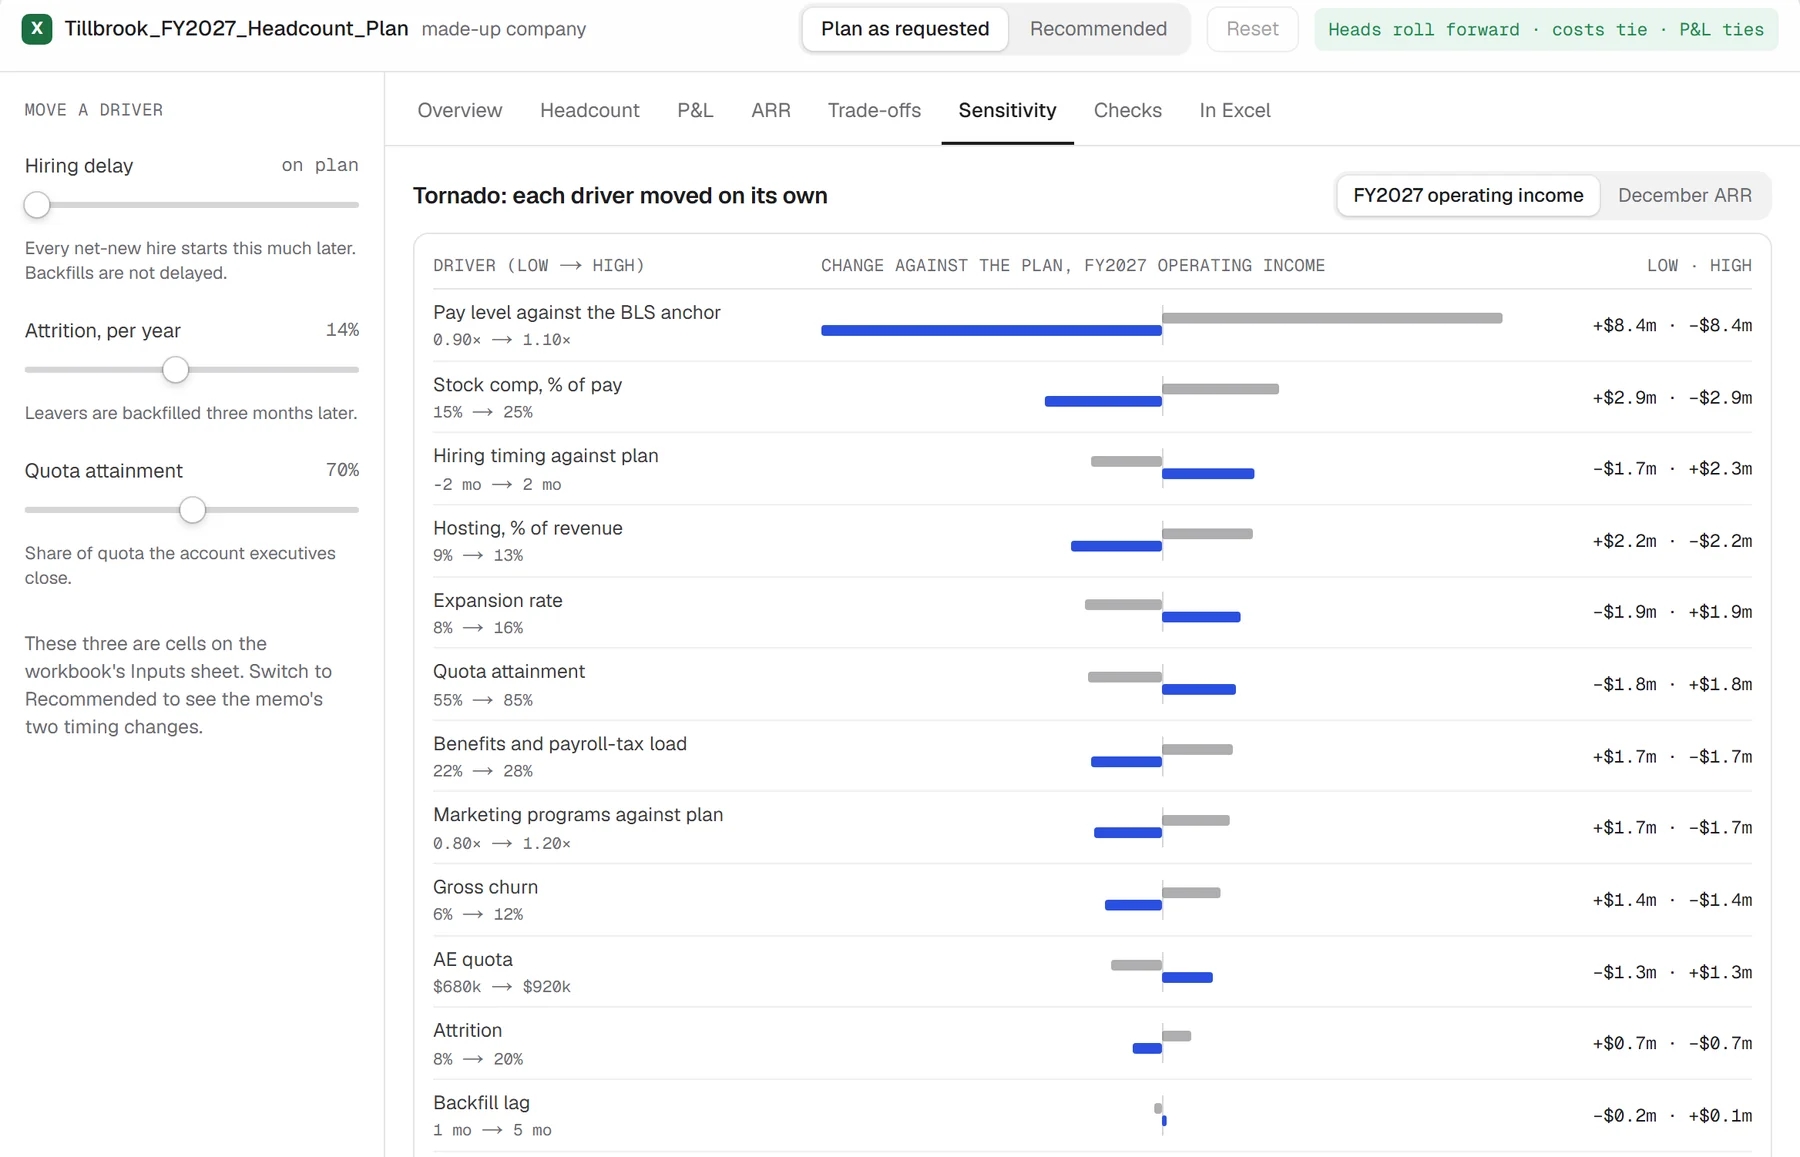
The two drivers that matter most. For FY2027 operating income it is pay level against the BLS anchor: each 1% on pay moves operating income by about $0.84m. The recommended plan has almost no room on pay: offers running more than about 0.22% above the plan's rates take its margin below the benchmark median, so I would track first-quarter offers against the plan's rates and revisit the second-half hires if they run over. For December ARR it is quota attainment: 55% instead of 70% takes $5.5m off December ARR; 85% adds $5.5m. The two-way tables cross pay with attainment for operating income, and attainment with the expansion rate for ARR.
Anchors. Base pay is pegged to BLS wage data for the San Francisco-Oakland-Fremont area (May 2025, 15 series), raised to 2027 at the BLS Employment Cost Index for Information-industry wages (+2.9% over the last 12 months). The 24.7% benefits and payroll-tax load is from BLS employer-cost data. The targets are medians from a benchmark of 124 US-listed software companies' latest 10-K filings (GAAP); revenue per head is the median of 9 public software companies, read from their 10-K employee counts.
Source: memo.md, written from Tillbrook_FY2027_Headcount_Plan.xlsx after Excel recalculation. Tillbrook Software is a made-up company.
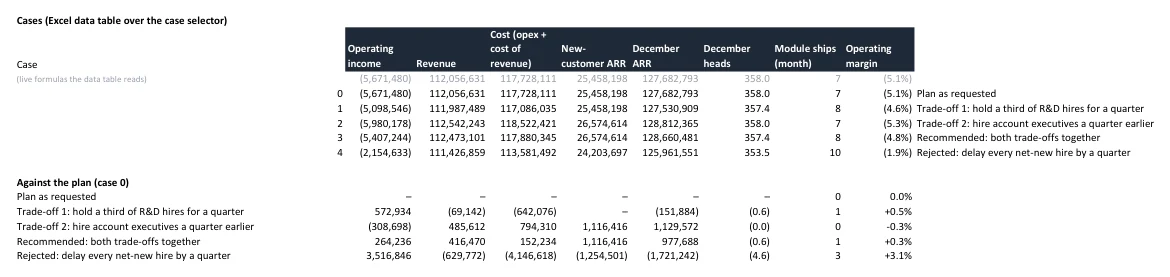
The trade-offs, and the option rejectedFive cases from the workbook's data table; the recommendation is the two trade-offs together
| Against the plan as requested | FY2027 cost | Operating income | December ARR | Module ships |
|---|---|---|---|---|
| Plan as requested | $117.7m | −$5.7m | $127.7m | July |
| Trade-off 1: hold a third of R&D hires for a quarter | −$0.64m | +$0.57m | −$0.15m | August |
| Trade-off 2: hire account executives a quarter earlier | +$0.79m | −$0.31m | +$1.13m | July |
| Recommended: both trade-offs together | +$0.15m | +$0.26m | +$0.98m | August |
| Rejected: delay every net-new hire by a quarter | −$4.15m | +$3.52m | −$1.72m | October |
Holding back a third of the R&D hires costs little ARR this year because only the roadmap module depends on them in the model, and it ships one month later. The real cost is the later roadmap items, which the model does not count; that is why the memo holds a third and not all of them. Hiring the account executives a quarter earlier adds ARR that, at a 78% gross margin, earns back its extra cost in about 11 months.
Delaying every hire by a quarter would lift FY2027 operating income by $3.52m, but the hires still arrive, so the saving happens once, while the $1.72m of December ARR it gives up is lost every year after. With the two timing changes the plan's operating margin is −4.8%, already at the benchmark median of −5.0%, without giving up ARR.
Which drivers matter mostTwo tornadoes, then two-way tables on the drivers that move each number most
| Driver, low → high | FY2027 operating income | December ARR |
|---|---|---|
| Pay level against the BLS anchor · 0.90× → 1.10× | +$8.4m / −$8.4m | none |
| Stock comp, % of pay · 15.0% → 25.0% | +$2.9m / −$2.9m | none |
| Hiring timing against plan · -2 mo → 2 mo | −$1.7m / +$2.3m | +$0.9m / −$1.2m |
| Hosting, % of revenue · 9.0% → 13.0% | +$2.2m / −$2.2m | none |
| Expansion rate · 8.0% → 16.0% | −$1.9m / +$1.9m | −$4.4m / +$4.6m |
| Quota attainment · 55.0% → 85.0% | −$1.8m / +$1.8m | −$5.5m / +$5.5m |
| Benefits and payroll-tax load · 21.7% → 27.7% | +$1.7m / −$1.7m | none |
| Marketing programs against plan · 0.80× → 1.20× | +$1.7m / −$1.7m | none |
| Gross churn · 6.0% → 12.0% | +$1.4m / −$1.4m | +$3.4m / −$3.3m |
| AE quota · $680,000 → $920,000 | −$1.3m / +$1.3m | −$3.9m / +$3.9m |
| Attrition · 8.0% → 20.0% | +$0.7m / −$0.7m | +$0.3m / −$0.3m |
| Backfill lag · 1 mo → 5 mo | −$0.2m / +$0.1m | 0 / 0 |
| AE ramp · 4 mo → 9 mo | +$0.2m / −$0.2m | +$0.7m / −$0.8m |
| Module ARR per month · $75,000 → $225,000 | −$0.1m / +$0.1m | −$0.5m / +$0.5m |
| Pay level against the BLS anchor ↓ · quota attainment → | 55.0% | 62.5% | 70.0% | 77.5% | 85.0% |
|---|---|---|---|---|---|
| 0.90× | $0.9m | $1.8m | $2.7m | $3.6m | $4.5m |
| 0.95× | −$3.3m | −$2.4m | −$1.5m | −$0.6m | $0.3m |
| 1.00× | −$7.5m | −$6.6m | −$5.7m | −$4.8m | −$3.9m |
| 1.05× | −$11.7m | −$10.8m | −$9.9m | −$8.9m | −$8.0m |
| 1.10× | −$15.8m | −$14.9m | −$14.0m | −$13.1m | −$12.2m |
Source: Sensitivity sheet, Excel data table over the live model; the browser engine gives the same 25 cells.
| Quota attainment ↓ · expansion rate → | 8.0% | 10.0% | 12.0% | 14.0% | 16.0% |
|---|---|---|---|---|---|
| 55.0% | $117.8m | $120.0m | $122.2m | $124.4m | $126.6m |
| 62.5% | $120.6m | $122.7m | $124.9m | $127.2m | $129.4m |
| 70.0% | $123.3m | $125.5m | $127.7m | $129.9m | $132.3m |
| 77.5% | $126.0m | $128.2m | $130.4m | $132.7m | $135.1m |
| 85.0% | $128.7m | $130.9m | $133.2m | $135.5m | $137.9m |
Source: Sensitivity sheet, Excel data table over the live model; the browser engine gives the same 25 cells.
Profit is most sensitive to what each hire costs, not to how many there are: each 1% on pay is about $0.84m of operating income. If first-quarter offers run more than about 0.22% above the plan's rates, the recommended plan's margin falls below the benchmark median. Higher attrition costs profit as well as ARR: every leaver is replaced, so each one brings recruiting and equipment cost, the January–March refills of last year's leavers start on full pay, and new account executives take six months to ramp.
Assumptions and where they come from15 roles pegged to 15 BLS wage series; every other assumption says why
Level 1 is pegged to the occupation's San Francisco median, level 2 to its 75th percentile, level 3 to the median of the matching manager occupation. Account executives (level 2 in Sales) use the 75th percentile of technical sales representatives; commission comes on top. Pay is raised from May 2025 to January 2027 at the Employment Cost Index for Information-industry wages, and again by the same rate in April.
| Role | Team | SOC · statistic | BLS annual pay | Opening heads | Net-new hires | BLS series |
|---|---|---|---|---|---|---|
| Software engineer | R&D | 15-1252 · median | $187k | 46 | 14 | OEUM004186000000015125213 |
| Senior software engineer | R&D | 15-1252 · 75th pct | $220k | 33 | 8 | OEUM004186000000015125214 |
| Engineering manager | R&D | 11-3021 · median | $233k | 11 | 2 | OEUM004186000000011302113 |
| Sales development rep | Sales | 41-3091 · median | $97k | 20 | 4 | OEUM004186000000041309113 |
| Account executive | Sales | 41-4011 · 75th pct | $172k | 42 | 12 | OEUM004186000000041401114 |
| Sales manager | Sales | 11-2022 · median | $171k | 7 | 2 | OEUM004186000000011202213 |
| Marketing specialist | Marketing | 13-1161 · median | $123k | 15 | 3 | OEUM004186000000013116113 |
| Senior marketing specialist | Marketing | 13-1161 · 75th pct | $171k | 10 | 2 | OEUM004186000000013116114 |
| Marketing manager | Marketing | 11-2021 · median | $220k | 5 | 0 | OEUM004186000000011202113 |
| Support specialist | Customer success | 15-1232 · median | $89k | 35 | 5 | OEUM004186000000015123213 |
| Senior support / customer success | Customer success | 15-1232 · 75th pct | $107k | 18 | 3 | OEUM004186000000015123214 |
| Support and success manager | Customer success | 11-9199 · median | $210k | 7 | 0 | OEUM004186000000011919913 |
| Accountant / people / legal ops | G&A | 13-2011 · median | $111k | 27 | 3 | OEUM004186000000013201113 |
| Senior accountant / analyst | G&A | 13-2011 · 75th pct | $144k | 16 | 2 | OEUM004186000000013201114 |
| Finance / G&A manager | G&A | 11-3031 · median | $216k | 8 | 0 | OEUM004186000000011303113 |
| Assumption | Value | Kind | Basis |
|---|---|---|---|
| Pay escalation, May 2025 to Jan 2027 | 1.0488× | anchor | BLS pay is for May 2025. Raised to January 2027 at the latest 12-month change in the Employment Cost Index for Information-industry wages (2.9%), over 20 months: (1 + 0.029)^(20/12). (CIU2025100000000A) |
| April merit increase | 2.9% | anchor | April merit increase for everyone employed, at the same ECI 12-month change. (CIU2025100000000A) |
| Merit month | 4 mo | judgment | Merit increases take effect in April (a common cycle after the year-end review). |
| Benefits and payroll-tax load | 24.7% of pay | anchor | Employer benefits and payroll taxes on top of cash pay: (insurance + retirement + legally required) / (wages + paid leave + supplemental pay), BLS ECEC, private industry, Information industry, Q2 2026. (CMU2135100000000D, CMU2185100000000D, …) |
| Stock comp | 20.0% of pay | judgment | Stock compensation expense at 20% of base pay. The resulting stock comp / revenue is compared with the benchmark median (11.8%) on the Targets sheet. |
| Pay level against the BLS anchor | 1.00× | judgment | Pay level against the BLS anchor (1.0 = the anchor). The tornado moves it ±10%. |
| Equipment per hire | $3,000 per hire | judgment | Laptop and set-up per new hire, new or backfill. |
| Software per head | $400 per head per month | judgment | Per-seat software (productivity, security, collaboration, role tools). |
| Recruiting per hire | $15,000 per hire | judgment | Recruiting cost per hire (in-house recruiters, sourcing tools, some agency use), booked in G&A. |
| Rent | $185,000 per month | judgment | San Francisco office for about 180 desks with hybrid work; allocated to departments by heads. |
| T&E, R&D | $250 per head per month | judgment | Travel and entertainment, R&D. |
| T&E, Sales | $1,200 per head per month | judgment | Travel and entertainment, Sales (customer visits). |
| T&E, Marketing | $500 per head per month | judgment | Travel and entertainment, Marketing (events). |
| T&E, customer success | $250 per head per month | judgment | Travel and entertainment, customer success and support. |
| T&E, G&A | $250 per head per month | judgment | Travel and entertainment, G&A. |
| Marketing programs | $700,000 per month | judgment | Marketing programs (paid media, events, content), about 8% of revenue. |
| Programs against plan | 1.00× | judgment | Marketing programs against plan (1.0 = plan). The tornado moves it ±20%. |
| Audit, legal, insurance, systems | $250,000 per month | judgment | Audit, legal, insurance and finance systems. |
| Hosting | 11.0% of revenue | judgment | Cloud hosting and third-party services in cost of revenue. |
| Commission | 10.0% of new ARR | judgment | Sales commission on new-customer ARR, expensed when booked (no capitalisation in this plan). |
| Opening ARR (31 Dec 2026) | $98,000,000 | judgment | Opening ARR, 31 Dec 2026. Set so FY2027 revenue per average head lands near the peer median ($336k; peers' quartiles $268k to $433k). (0001625641-26-000044, 0001193125-26-057847, …) |
| AE quota | $800,000 new ARR per AE per year | judgment | Annual new-ARR quota for a fully ramped account executive. |
| Quota attainment | 70.0% of quota | judgment | Average quota attainment across account executives. Slider on the page. |
| AE ramp | 6 mo | judgment | A new account executive ramps in a straight line to full productivity over 6 months (none in the first month). |
| Gross churn | 9.0% of ARR per year | judgment | Gross ARR churn (lost customers and downgrades). |
| Expansion | 12.0% of ARR per year | judgment | Expansion ARR from existing customers (seats, upgrades), before the new module. |
| Module: engineer-months needed | 40 engineer-months | judgment | The roadmap module needs 40 engineer-months from this year's new engineers; it ships the month after. At plan hiring that is July 2027. |
| Module: ARR added a month | $150,000 ARR per month | judgment | Expansion ARR the module adds each month after it ships. |
| Attrition | 14.0% per year | judgment | Voluntary and involuntary attrition, all departments. Slider on the page. |
| Backfill lag | 3 mo | judgment | Months from a leaver's last day to the backfill's start. |
| Hiring delay | 0 mo | judgment | Hiring delay applied to every net-new hire (not backfills). Slider on the page. |
| R&D hires held back | 0.00 | judgment | Share of R&D net-new hires held back (trade-off 1 sets it to one third). |
| Months held back | 0 mo | judgment | How long those R&D hires are held back (trade-off 1: 3 months). |
| AE hires brought forward | 0 mo | judgment | Account executive hires brought forward (trade-off 2: 3 months, never before January). |
The targetsMedians from a benchmark of 124 public software companies' 10-K filings
The rule: sales and marketing and R&D both rise with growth, so their targets are the medians of the benchmark's fastest-growing third of companies, the third whose median growth is nearest the plan's 30% ARR growth. G&A, gross margin and operating margin use the benchmark's own medians.
Benchmark (projects/opex-benchmark/out/targets.json): SEC XBRL data (data.sec.gov companyfacts), latest 10-K fiscal year ending Jan 2025 to Jan 2026, 124 US-listed SIC 7372 software companies with revenue of $100M or more; GAAP, so every line includes stock-based compensation. S&M 37.3%: the median of the benchmark's growth third 3 (median revenue growth 25.8%, n=38), the third nearest the plan's 30% ARR growth; the all-growth median is 33.2%; R&D 26.7%: the median of growth third 3 (n=41), by the same rule; the all-growth median is 21.4%; G&A 22.4% ($100M-$300M, n=16); gross margin 72.4%, operating margin -5.0% and stock comp 11.8% are the under-$1B medians (n=70). Ranges are the 25th to 75th percentile of all growth rates. Revenue per head stays on this project's nine-company peer median.
| FY2027, % of revenue | Plan | Recommended | Target | Benchmark 25th–75th, all growth rates |
|---|---|---|---|---|
| Gross margin | 78.3% | 78.4% | 72.4% | |
| R&D | 31.7% | 31.0% | 26.7% | 14.6% – 26.5% |
| Sales and marketing | 36.4% | 37.0% | 37.3% | 20.9% – 42.5% |
| G&A | 15.2% | 15.2% | 22.4% | 19.5% – 28.2% |
| Operating margin | −5.1% | −4.8% | −5.0% |
R&D is the one line over its target, mostly because the plan pays every engineer at San Francisco rates. G&A sits below the benchmark's 25th percentile; the benchmark notes that smaller companies run higher G&A, so that line is more likely under-budgeted than over.
Revenue per head is not in the benchmark, so opening ARR is sized on nine public software companies' revenue and the employee counts their 10-K filings state: the plan's $327k per average head sits near their $336k median.
| Company | Fiscal year end | Revenue | Employees | Revenue per employee | Accession |
|---|---|---|---|---|---|
| LAW | 2025-12-31 | $157m | 577 | $272k | 0001625641-26-000044 |
| AMPL | 2025-12-31 | $343m | 780 | $440k | 0001193125-26-057847 |
| WEAV | 2025-12-31 | $239m | 904 | $264k | 0001609151-26-000016 |
| EGAN | 2026-06-30 | $91m | 422 | $216k | 0001104659-26-106739 |
| YEXT | 2026-01-31 | $447m | 1,120 | $399k | 0001628280-26-016402 |
| EXFY | 2025-12-31 | $142m | 117 | $1,215k | 0001476840-26-000009 |
| CMRC | 2025-12-31 | $342m | 1,079 | $317k | 0001193125-26-085687 |
| PD | 2026-01-31 | $493m | 1,155 | $426k | 0001568100-26-000012 |
| SPT | 2025-12-31 | $458m | 1,362 | $336k | 0001517375-26-000015 |
| Median | $336k |
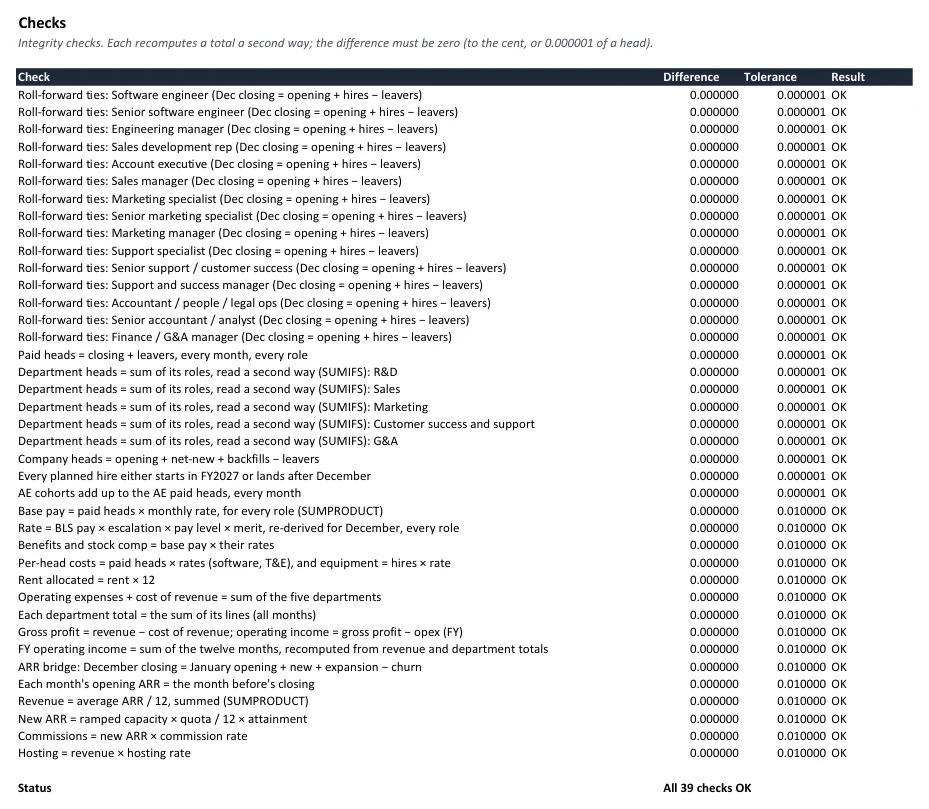
How it is built and checkedOne engine for the page and the workbook's twin formulas; 39 integrity checks; 5,858 cells compared
Heads
Each of 15 roles rolls forward monthly: opening + net-new hires + backfills − leavers = closing. Leavers go at the attrition rate; each is backfilled three months later, and the seat costs nothing while it is empty.
Cost
Paid heads × each role's monthly base rate, plus the 24.7% benefits load, stock comp, equipment for every hire, software and T&E per head, and rent shared by heads. Commissions, marketing programs, recruiting, other G&A and hosting are their own lines.
Revenue
Account executives are tracked by hiring cohort: each ramps over six months, then closes quota × attainment. New ARR, expansion and churn make the ARR bridge; revenue is average ARR ÷ 12. A roadmap module ships once this year's new engineers have put in 40 engineer-months.
Checks
All 39 checks OK in the workbook, from roll-forwards and SUMIFS re-reads of department heads to the ARR bridge and P&L ties.
Page = workbook
The pipeline sets the workbook's three slider cells on a grid of 36 settings and each decision case, lets Excel recalculate, and compares 5,858 cells with the browser engine, including every data-table cell. The largest difference is 3e-8 dollars.
What the checks caught
The check that account-executive cohorts add up to AE heads failed on the first build: both the workbook and the engine let a new hire leave in the month they started, which the roll-forward does not. Both were fixed. The reader for employee counts in the 10-K filings first took one company's sales and marketing headcount as its total; it now skips department counts.
Limits and next
Tillbrook is made up, so nothing here describes a real company's plan. The pay anchor is the all-industry wage for each occupation in the San Francisco area, which a software company may pay above; that is why pay level leads the tornado. Opening account executives are treated as fully ramped, commissions are expensed when booked, and the roadmap module is the only revenue that R&D hires drive inside the year.
Next: add a location mix for R&D, and run the month-end variance against this plan.
Files
Tillbrook Software is a made-up company. BLS and SEC data are public; nothing here is investment advice.