Public dataSEC filings · NYSE: TOST

Financial modeling

Toast operating model

A quarterly three-statement model of Toast, built from its SEC filings, to find the few drivers that decide its profit through FY2029. In the model, 94.6% of FY2026 revenue growth comes from new locations, and each basis point of fintech spread is worth about $28m of FY2027 EBITDA. Its Q3'26 EBITDA forecast, $244m, was put on record on 21 October 2026, before Toast reports the quarter.

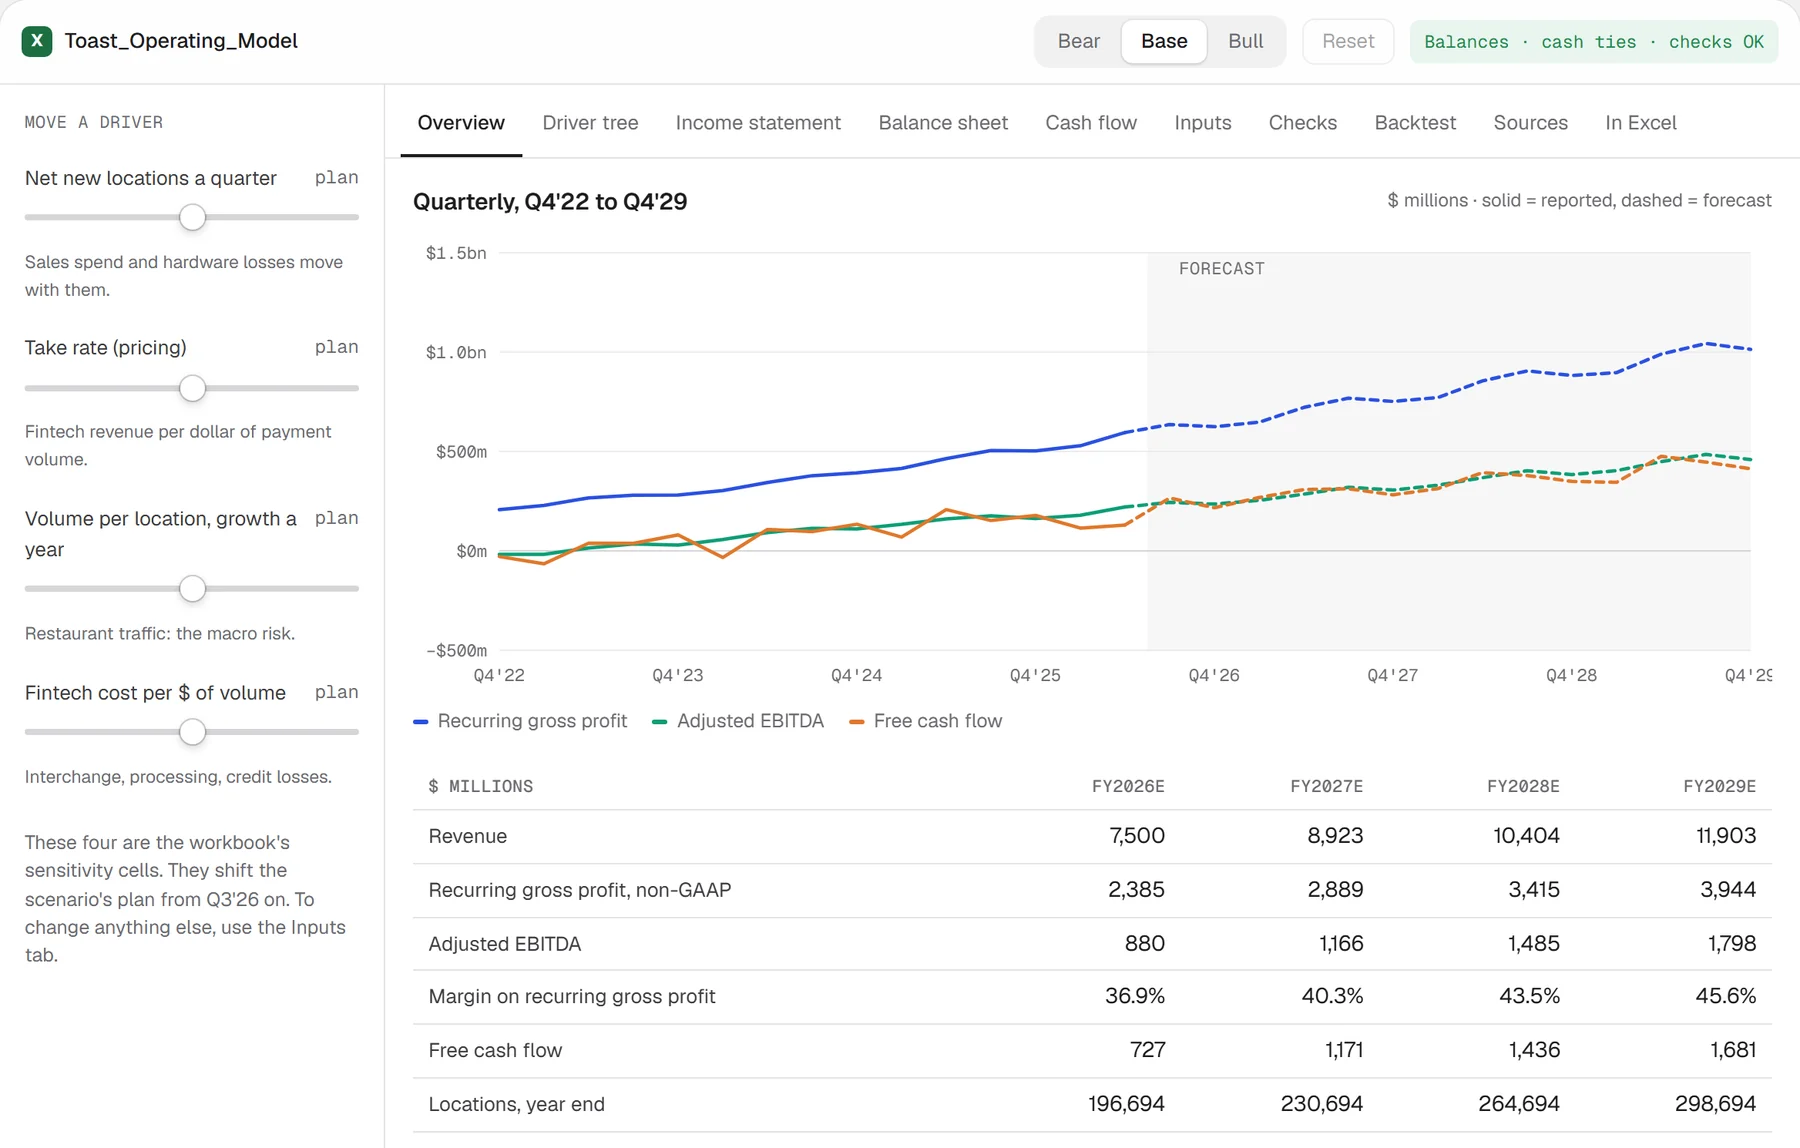
The Toast operating model with its driver sliders, scenarios, the quarterly chart and the FY2026 to FY2029 summary.

Give me a company's filings and I'll build the model: quarterly, three statements, driver-based, with scenarios and checks. I built one for Toast, the restaurant software company, from its SEC filings. It shows that almost all of Toast's 2026 revenue growth comes from new locations, and that each basis point of payment spread is worth about $28m of 2027 EBITDA. Its forecast for Toast's Q3 2026 results went on record on 21 October 2026, before Toast reports.

The model

Switch the scenario or move a driver, and the three statements recalculate. The balance sheet still balances and cash still ties.

Download .xlsx · 316 KB
Toast_Operating_Model
Balances · cash ties · checks OK

Quarterly, Q4'22 to Q4'29

$ millions · solid = reported, dashed = forecast
−$500m$0m$500m$1.0bn$1.5bnQ4'22Q4'23Q4'24Q4'25Q4'26Q4'27Q4'28Q4'29Forecast
Recurring gross profitAdjusted EBITDAFree cash flow
$ millionsFY2026EFY2027EFY2028EFY2029E
Revenue7,5008,92310,40411,903
Recurring gross profit, non-GAAP2,3852,8893,4153,944
Adjusted EBITDA8801,1661,4851,798
Margin on recurring gross profit36.9%40.3%43.5%45.6%
Free cash flow7271,1711,4361,681
Locations, year end196,694230,694264,694298,694

FY2026E = H1 reported + H2 forecast. Margin = Adjusted EBITDA ÷ non-GAAP recurring gross profit, Toast's own definition. Changes against the workbook are shown under each number.

How it was built. I built it with an AI agent system I run. It wrote the pipeline and the workbook to my brief, I went through it myself, and a separate check re-derives its figures from the source data.

FY2024Delivered $373m, 78% above the first outlook
180290400Actual 373Feb+78%May+43%Aug+26%Nov+4%
FY2025Delivered $633m, 22% above the first outlook
450560670Actual 633Feb+22%May+15%Aug+10%Nov+3%
FY2026Not reported yet. Base $880m is 8% above the latest outlook
680810930Base 880Feb+12%May+10%Aug+8%
Outlook range and midpoint, by month issuedDeliveredModel Base% = delivered (or Base) above the midpoint · $ millions
Toast has beaten every full-year EBITDA outlook since 2024, by less each year. FY2026 is not reported yet, so its line is the model's Base case.
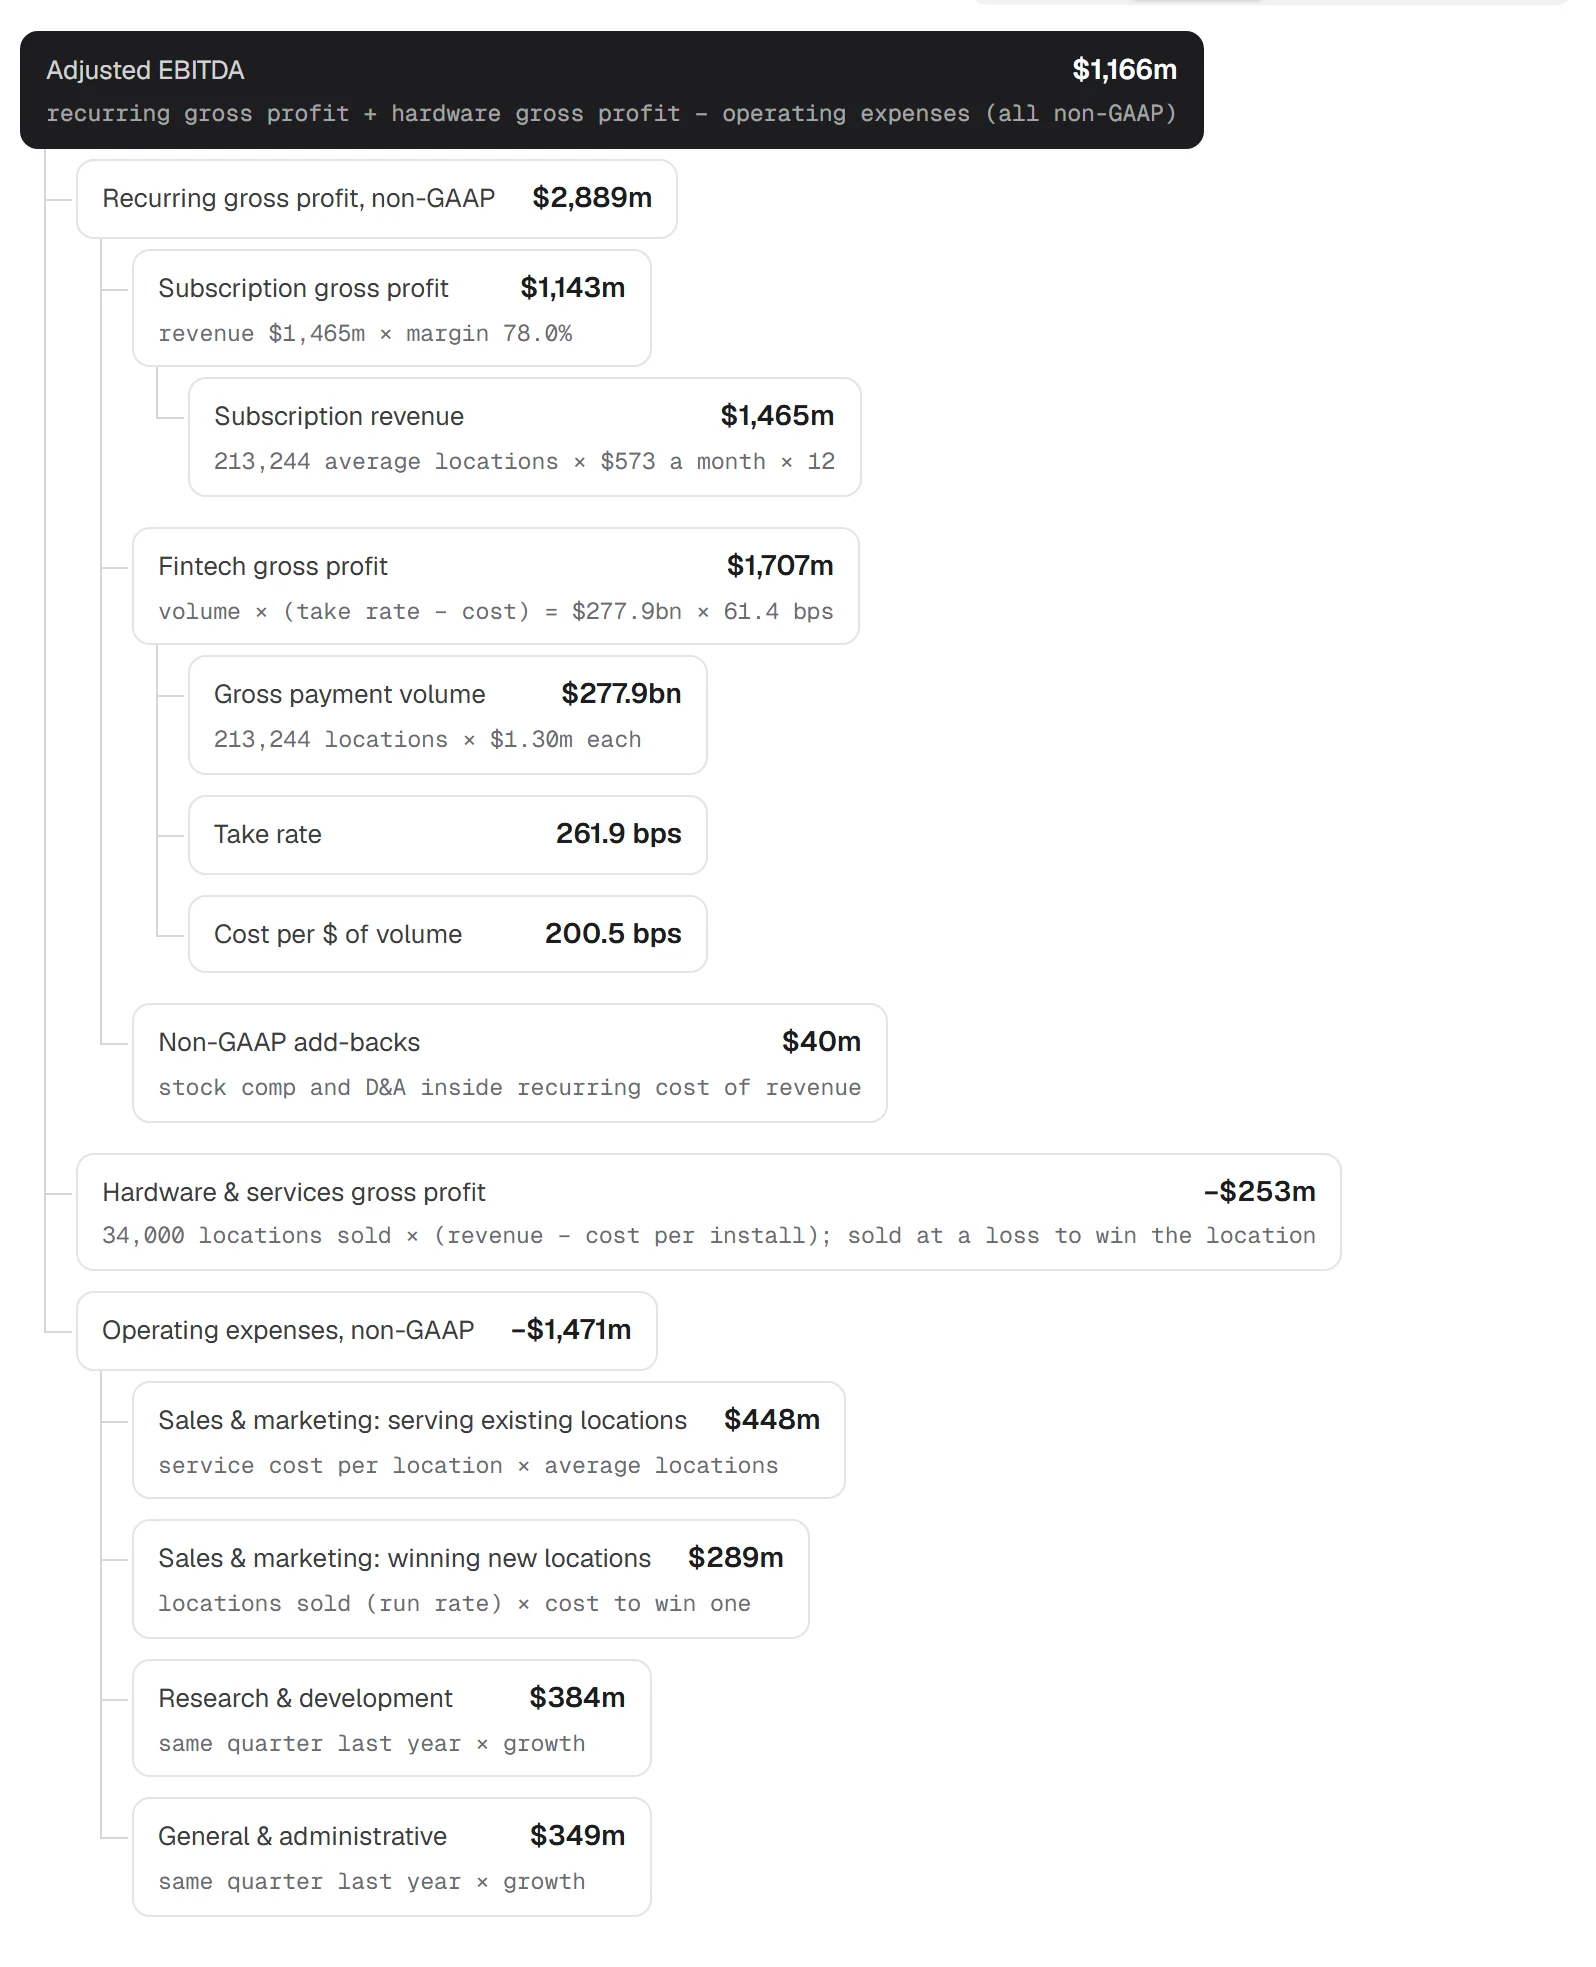
The model's driver tree for FY2027 Adjusted EBITDA
In the driver tree, every box is computed from the boxes under it, from locations, volume and take rate up to EBITDA.
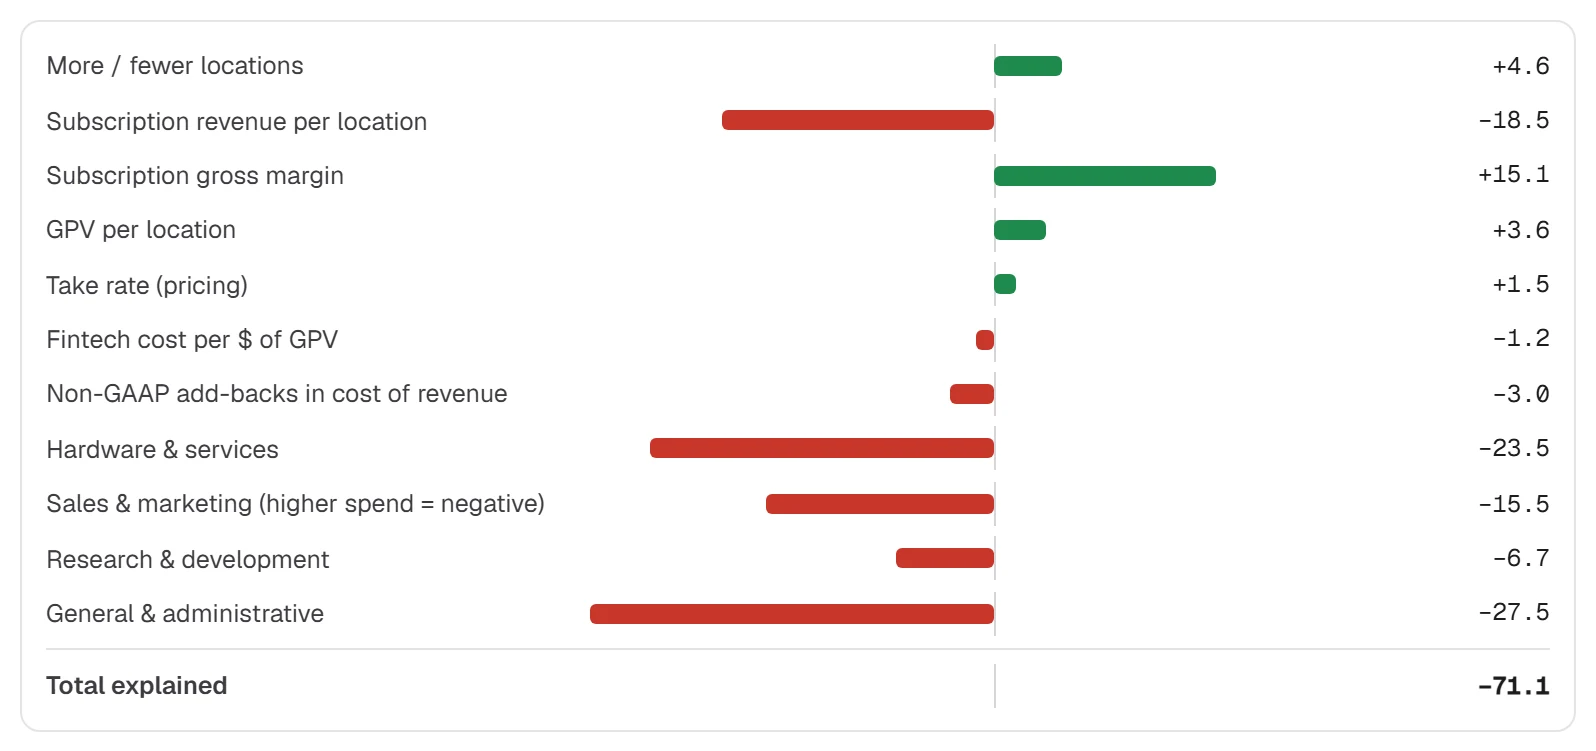
Where the H2 2025 Adjusted EBITDA miss came from, by driver
Frozen at Q2'25 and run forward, the method missed EBITDA by 21.0%, because G&A, hardware losses and sales spend ran ahead of the rules.
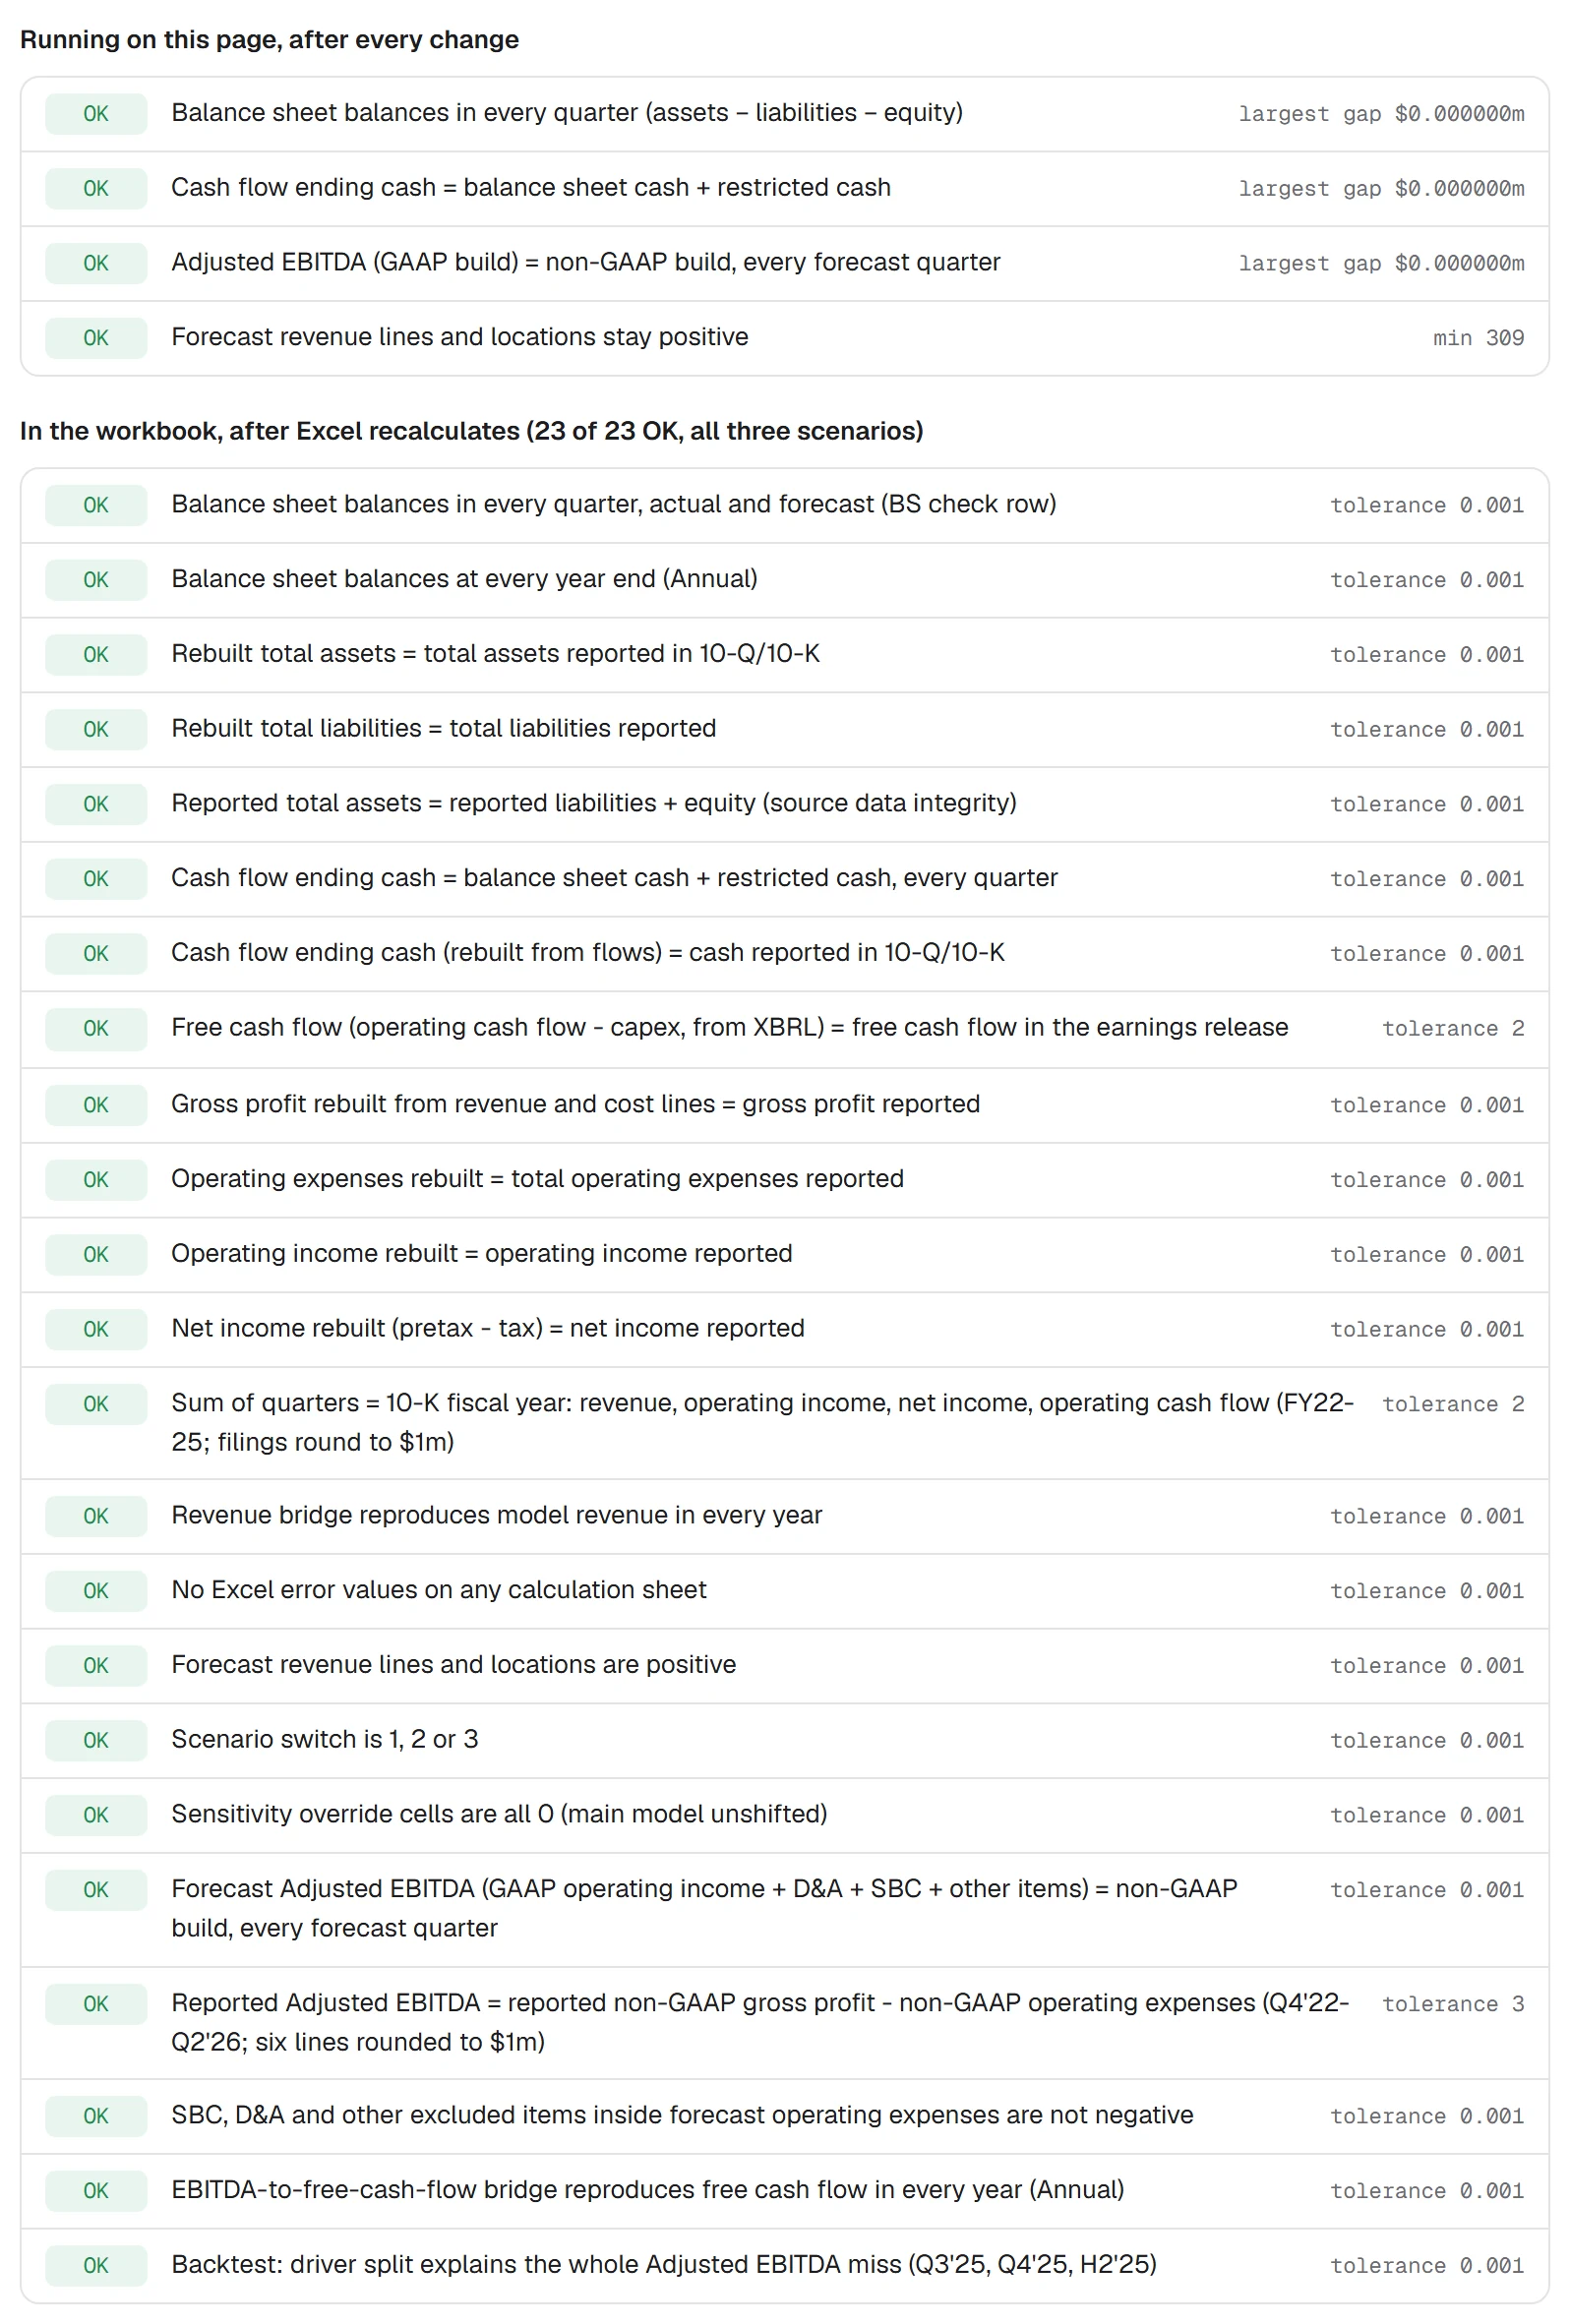
The model's checks, all OK
All 23 checks pass in all three scenarios. The balance sheet balancing is a check, not a plug.

The full analysis

Each part opens on click.

The answer, by scenarioBase, Bear and Bull to FY2029, and the four things that decide them
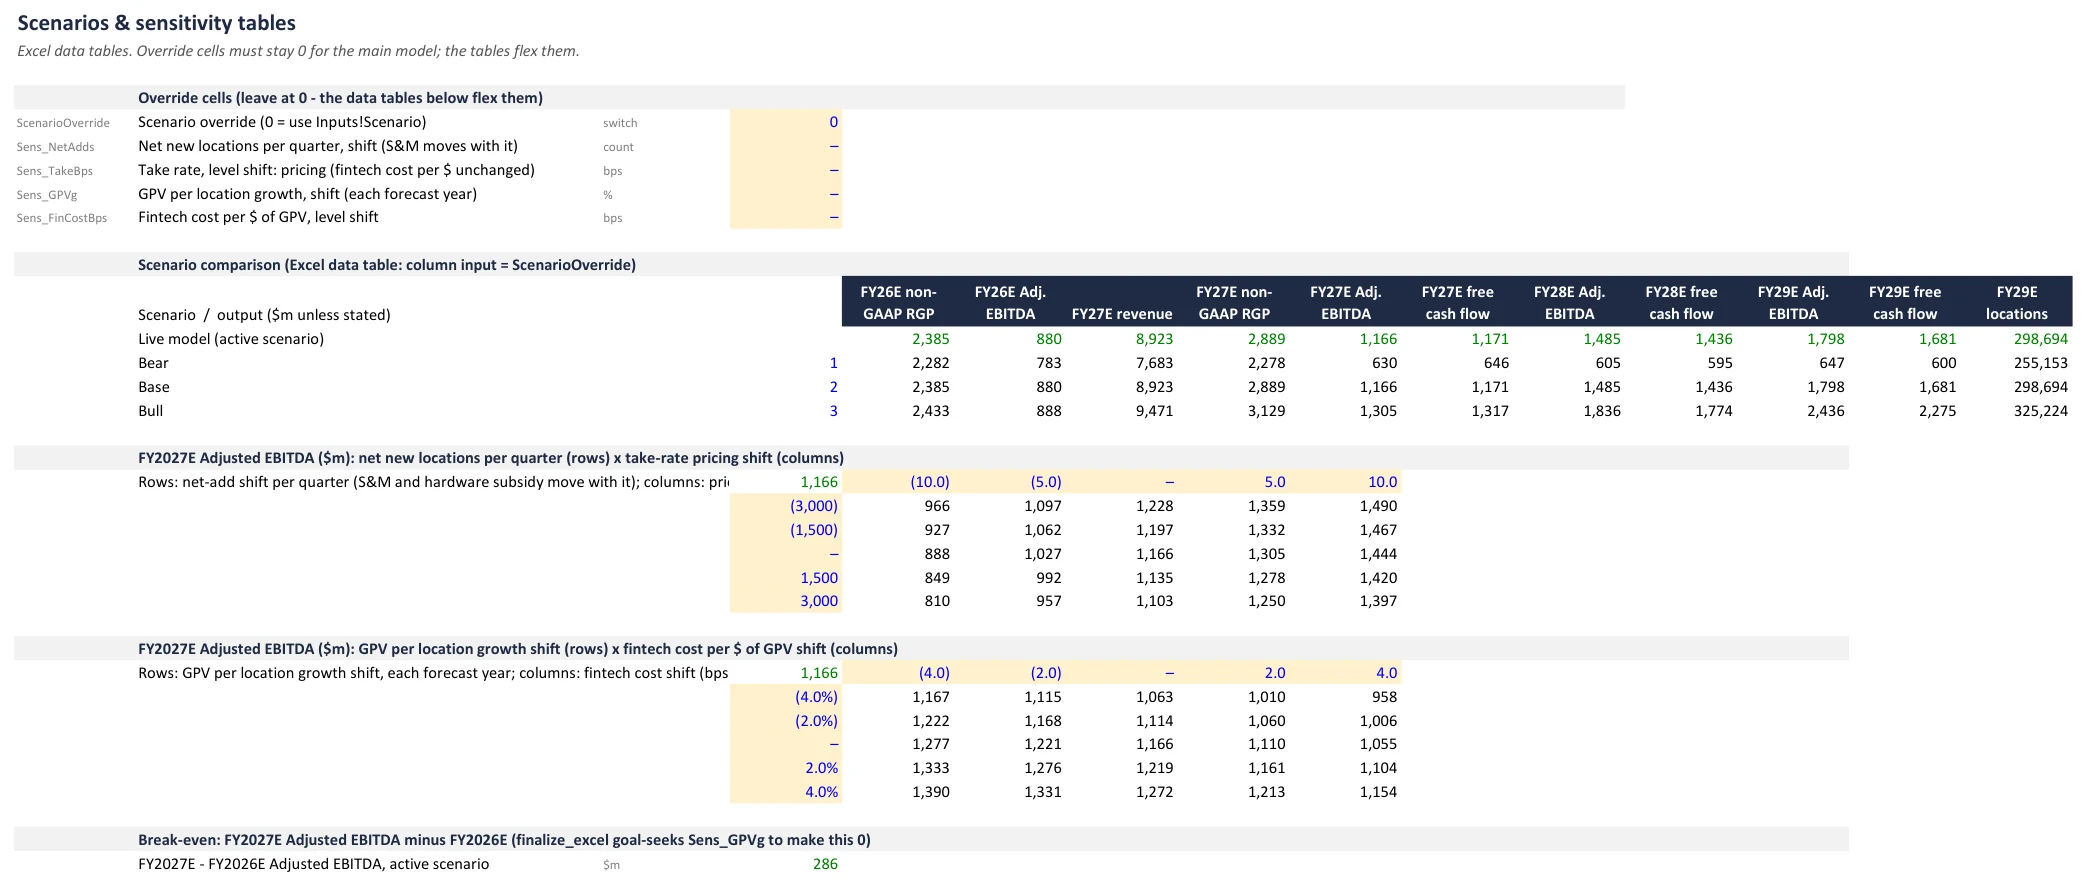
Exhibit 1Base case: $1,166m of FY2027 Adjusted EBITDA. A recession case takes it to $630m, down from $783m in FY2026.
Adjusted EBITDAFY2026EFY2027EFY2028EFY2029EFY27 marginFY27 free cash flow
BearVolume per location falls, churn cuts net adds, pricing slips$783m$630m$605m$647m28%$646m
Base$880m$1,166m$1,485m$1,798m40%$1,171m
BullMore net adds, paid for up front$888m$1,305m$1,836m$2,436m42%$1,317m

Source: Toast_Operating_Model.xlsx, Sensitivity sheet (scenario comparison), after Excel recalculation. Margin = Adjusted EBITDA ÷ non-GAAP recurring gross profit, Toast's own definition.

Free cash flow is above Adjusted EBITDA in FY2027 because interest income ($50m) and working capital ($105m) add more than taxes ($52m), capital spending ($76m) and other items ($22m) take away: $1,166m of EBITDA becomes $1,171m of free cash flow.

01
~$28m

Each basis point of fintech spread, price or payment cost, is worth about $28m of FY2027 EBITDA

Five basis points of take rate add $139m; two basis points of extra payment cost take away $56m. Three drivers decide FY2027: net new locations, that spread, and the cost to win a location. 1,500 more net adds a quarter cost $31m of FY2027 EBITDA up front, because sales spend and hardware losses come before the gross profit.

Track fintech gross profit per dollar of volume: price and cost move it by the same amount.
02
94.6%

Growth is almost all new locations

94.6% of FY2026 revenue growth comes from more locations; volume per location has been falling in real terms. Each point a year of slower volume growth per location takes about $26m off FY2027 EBITDA ($103m for four points).

This is the macro risk in the model. Try it with the third slider in the model above.

03
13 months

Payback on a new location: about 13 months on the model's split, 8 if the service cost is $2.9k

Winning a location cost about $13.6k in FY2025; payback lengthens from about 13 months to about 14 by FY2027. Toast does not report how sales spend divides between new and existing customers.

The split is the model's biggest assumption, so the page gives both readings.

04
+8%

Toast beats its own outlook, by less each year

The August outlook midpoint was beaten by 26% in 2024 and 10% in 2025. Base FY2026 is $880m, 8% above the latest midpoint of $805–825m.

If Toast lands exactly on its outlook, FY2026 comes in $65m below Base.

On the record: Q3'26Put on record on 21 October 2026, before Toast reports, so the model can be scored
Q3'26BaseToast outlookActual
Adjusted EBITDA$244m$210–220mEarly November
Recurring gross profit, non-GAAP$636m$615–625mEarly November
Locations, end of quarter188,153n/aEarly November
Gross payment volume$62.1bnn/aEarly November

When Toast reports, the miss is split by driver the same way as the backtest, and the inputs that caused it are logged.

Backtest, and what it changedThe method run forward from Q2'25: 0.2% off on gross profit, 21.0% on EBITDA

Frozen at Q2'25 and run forward, the method missed recurring gross profit by 0.2% and Adjusted EBITDA by 21.0%. Gross profit was close because errors offset: subscription revenue was forecast 4.8% too high while fintech came in slightly ahead. EBITDA was too high because G&A, hardware losses and sales spend ran ahead of the rules. Toast's own outlook came in 17.1% below what it delivered over the same half.

What the backtest changed

H2 2026 Adjusted EBITDA
Toast's outlook, as issued$415m
Toast's outlook, grossed up by last H2's 21% beat$501m
The model's rules, corrected for their backtest errors$397m
The model's rules as they stand$481m
Base$480m

Base ($480m) sits between Toast's own outlook ($415m), which Toast has beaten every half and every 2026 quarter, and the outlook grossed up by last H2's beat ($501m). It assumes a 16% beat against last H2's 21%, in line with a beat that shrinks every year. The rules corrected for their backtest errors ($397m) would sit below an outlook Toast has never missed, so Base does not use them. Two inputs still lean against the lesson: non-GAAP G&A grows 13% in FY2027 against 19% over the last four quarters, and the hardware loss per new location eases from its H1 2026 level. At the backtest's levels, FY2027 Adjusted EBITDA would be $61m lower. The Q3'26 print is the first test of that call.

Inside the workbookSensitivity tables, unit economics, the revenue bridge, the checks and the sources

Two sensitivity tables, straight from Excel

FY2027 EBITDA against net adds and pricing, and against volume growth and payment cost. The browser reproduces all 50 cells.

Two sensitivity tables, straight from Excel
1 / 5
What to watchFive numbers an FP&A team at Toast should track every quarter
Net new locationsand, if Toast ever reports them, gross adds against churn.
Fintech gross profit per $ of volumetake rate less interchange, processing and credit losses.
Volume per location in real termsrestaurant traffic, after menu-price inflation.
Cost to win a locationsales spend on new sites plus the hardware loss per install.
EBITDA / recurring gross profitagainst Toast's own 30–35% medium-term and 40%+ long-term targets.
How it is built and checkedRevenue from drivers, expenses on Toast's basis, three statements, sources

Revenue from drivers

Subscription = locations × revenue per location. Fintech revenue = locations × volume per location × take rate; fintech cost = volume × cost per dollar, so price and cost are separate inputs. Hardware = locations sold × revenue and cost per install.

Expenses on Toast's basis

Sales and marketing = a service cost per existing location + locations sold × the cost to win one. R&D and G&A grow from the same quarter a year earlier. Stock comp and D&A move net income but not Adjusted EBITDA.

Three statements

Quarterly, with working-capital days, PP&E, securities, interest and equity roll-forwards. Cash comes from the cash flow statement; the balance sheet balancing is a check, not a plug.

Sources

890 tagged values from the 10-K and 10-Q filings, each re-checked against SEC's companyfacts API, 100 from the filings' own XBRL, 378 from earnings releases and 48 from filing text, investor materials, the IPO prospectus and BLS data.

In the browser

A line-by-line port of the workbook's forecast formulas: in Base, 2,548 forecast cells match the cached Excel values. Toast's stated Q1 2025 margin of 32% reproduces as 32.0%.

Limits and next

Locations are disclosed rounded, so per-location figures carry roughly 1% noise. Toast reports net adds, not gross adds and churn, and does not split sales spend between existing and new customers. There is no share price in the model, so no valuation.

Next: score Q3'26 when Toast reports and log the misses by driver; split fintech into payments and non-payments; add a valuation layer on the free cash flow lines.

Files